JSNA Place
1. Introduction
The place we live in influences our health. The built environment is human-made environment and provides settings for human activities i.e., work, live and play. It consists of parks, houses, shops, places of worship, factories, and highways. Healthy built environments are walkable and bikeable, include access to diversity of essential and desired services, include green spaces, and places for people to meet and mingle. Such environments support the physical and mental health of the local population by providing a desirable and safe place to live and allows making healthy life choices easier (e.g., exercise, walking, healthier food options, and cycling).
Wandsworth is an Inner London Borough with 20 wards covering an area of 13.23 sq. miles. The Borough has over 30 parks covering a fifth of the area. If all green spaces are included, a quarter of the Borough is covered in green spaces. The Borough also has 5 miles of river front. With the Borough’s good transport links, Wandsworth has a balance of proximity to Central London but with more accessibility to open space and a balance of high rise and low-rise buildings.
The Borough has 5 vibrant town centres - Balham, Clapham Junction, Putney, Tooting and Wandsworth Town. There are large housing and business developments in Wandsworth Town, Battersea and Nine Elms. There is further regeneration on Winstanley and York Road and the Alton Estates. Wandsworth is one of the top Boroughs in London in terms of length of the high street, with over 20 kilometres of high street spread across the Borough 1.
The Borough is well connected to Central London and other parts of London through public transport. Around two-thirds of residents take public transport to work. Less than 1 in 6 drive to work and car ownership has been decreasing in the Borough with almost half of households not having access to a car.
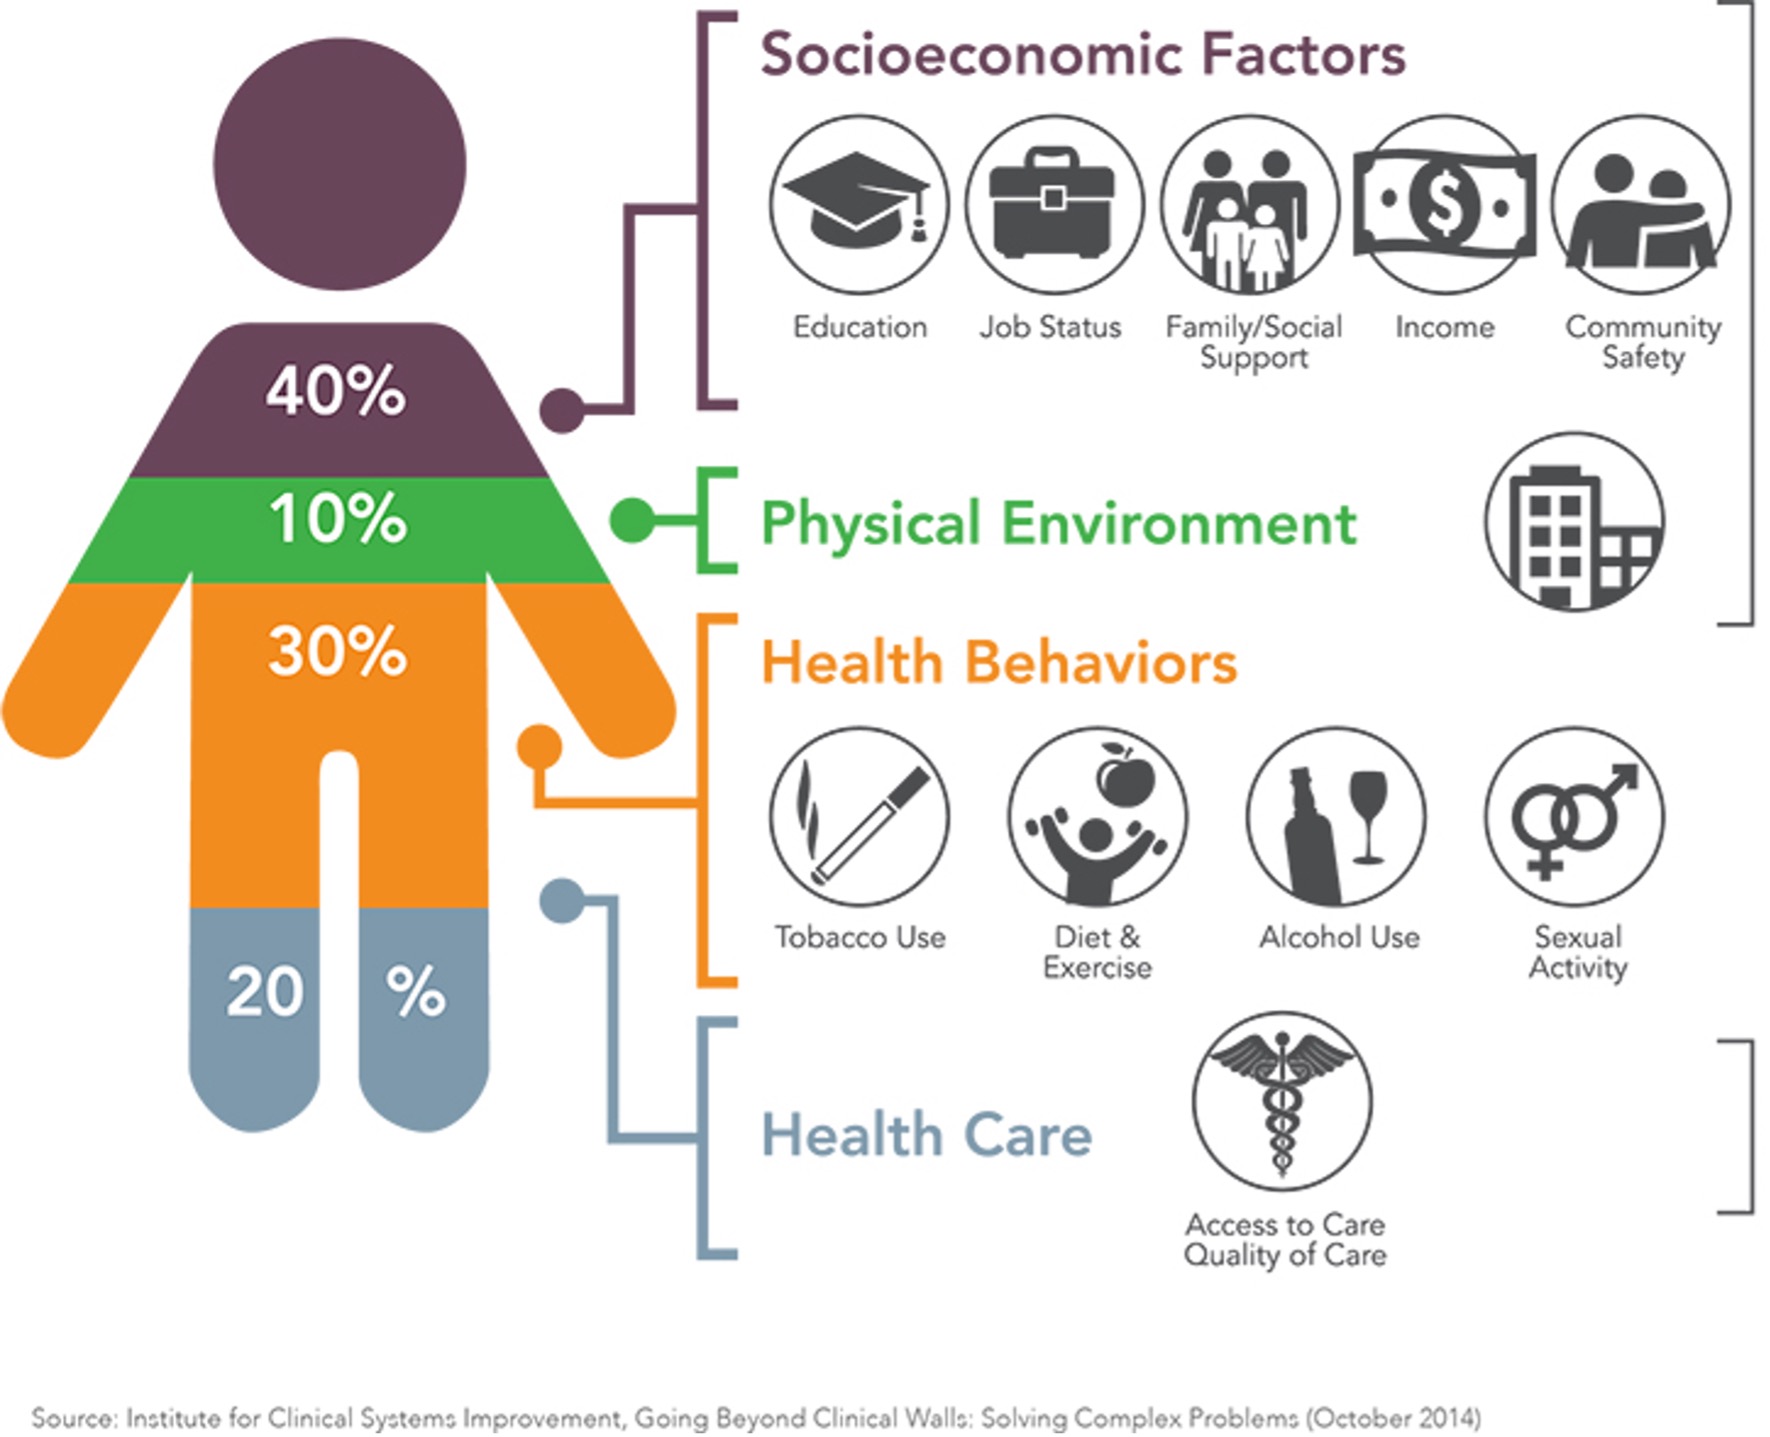
The largest contribution to our health and well-being is made by social and economic factors, and the environment we live in (figure below). Some factors that determine our health, such as age, gender and genetics, cannot be modified. Other factors, such as the environment, the place in which we live, the health behaviours of individuals and communities, and the impact of social or economic factors, can be modified or mitigated through individual and collective action as well as effective programs and policies.
Wandsworth is a large Inner London Borough with a younger, educated and economically active population that is mobile. Wandsworth is home to an estimated 328,828 residents the second highest in Inner London. By 2029 this will increase to more than 373,000, this is one of the fastest growth rates in London:
- Local population increase is currently driven by natural change (more births than deaths) and in the next 10 years by large new housing developments e.g., Nine Elms
- Of the projected population increase, 60% will happen in 4 wards – Queenstown, Fairfield, St. Mary’s Park and Thamesfield
- Wandsworth’s population is one of the youngest in the country, with a median age of 33.7 years (London=35.1) and has one of the highest proportions of populations aged 20–44 years, in London
- In the next 10 years the largest increase in number is expected among those aged 20–39 years, driven by people from other parts of UK moving in, but the largest percentage increase will be in age groups 60 years and older with the 85 + growing by 42%
- BAME population will stay relatively similar, around 30% in adults. Among those under 18, BAME children will continue to make up almost 45% of the under 18 population.
Wandsworth’s population is made up of people on the move, that is moving to and from London Boroughs, from other parts of UK, EU and beyond. During the last 10 years, 344,543 people moved into the Borough from within the UK, 360,038 moved out (net=-15,495). A further 66,801 international migrants moved out and 74,678 moved in (7,877). During the same time period there were 56,707 births and 17,010 deaths for a net natural change of +39,697.
Of the almost 150,000 properties in Wandsworth, over two-thirds are flats, and almost a third of households rent privately.
Wandsworth has remained within the least deprived second quartile of London Local Authorities, ranking 10th out of 33 (worse) in 2019, compared to 11th of 33 in 2015. Wandsworth does not have any areas that are among the 10% most deprived in the country. Wandsworth ranks amongst the least deprived Boroughs in London for five of the seven deprivation domains: income, employment, education, skills & training, barriers to housing & services, and crime. It has a particularly high ranking for education, skills & training, the living environment and income. Deprivation Affecting Older People Index, (IDAOPI) measures deprivation characteristics that are most likely to affect older people; IDAOPI ranking for Wandsworth was amongst the most deprived in London.
Wandsworth Borough has one of the highest employment rates at almost 80%, which is higher than the London and England averages. Residents are much more likely to be managers, directors, professionals and those in technical jobs (70.4%), compared to London (58.4%). This is because the area is a popular place of residence for those starting jobs in Westminster, the City and Canary Wharf.
Wandsworth performs well compared to other London Boroughs for most indicators, such as pay inequality, low pay, unemployment and housing delivery. The poverty rate of 21.5% is below the London average of 27%. Residents working full-time earned on average £34,168 in 2019. This was higher than the England average of £30,667 but lower than the London and Inner London earnings of £38,992 and £42,667 respectively. 0.9% of the Borough’s residents were claiming income support which was lower than the London and national average.
3,844 households claimed universal credit with the majority being single adult households with no dependent children. Wandsworth ranked 10th lowest Borough in London for those claiming child benefit. However, food banks providing emergency food supplies increased by 78% from previous 5 years, with one-third of food banks being for children of primary school age. Wandsworth ranked as the 6th lowest Borough in London for fuel poverty, with 1 in 10 households experiencing poverty.
2. Healthy Environments
The environment in which we live is a key determinant of people’s health and well-being. The planning system plays an important role in influencing the built and natural environment and therefore plays a key role in the physical and mental well-being of the population. A healthy environment can promote well-being and healthy lifestyles for all and can contribute to a reduction in health inequalities.
Unhealthy lifestyles, influenced by the environments in which we live, are contributing to a rise in preventable illnesses such as diabetes, obesity and cardiovascular and respiratory diseases. Prevention of ill-health by helping people to live healthier lives in order to prevent avoidable illness, is a major focus for the health services. Healthy and active people tend to be less dependent on health and social care services so there are tangible economic benefits in encouraging, and making it easy, for the population to lead healthy lifestyles.
Having a clean and healthy environment has a positive impact on people’s health and well-being. Creating a healthy environment includes tackling climate change. Reducing Wandsworth’s emissions is important in terms of protecting current and future residents of the Borough. Poor air quality is an identified cause cardiovascular and respiratory diseases as well as lung cancer. Access to green open space can increase people’s overall health and well-being. By addressing climate change we can improve the overall sustainability of Wandsworth and improve the health and well-being of residents.
2.1 Air Quality
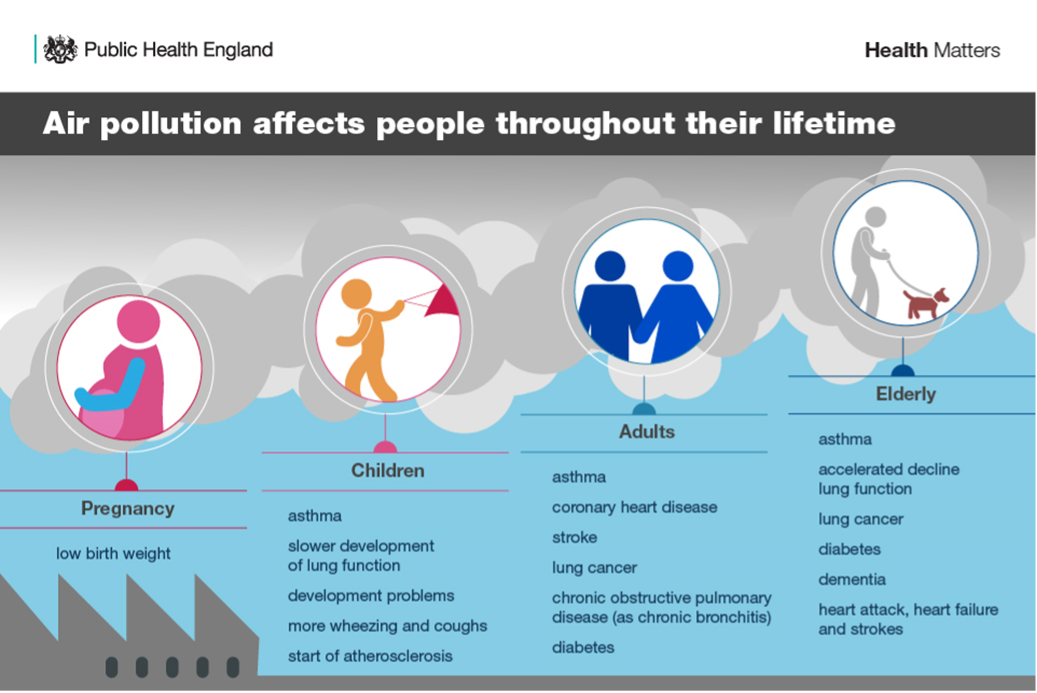
Air quality affects everyone. Exposure to air pollution and exposure to air pollutants are ubiquitous in the UK and in London. Exposure to these air pollutants has a negative impact on health in a number of ways across the life course, from pre-conception right through to old age. The health impact of air pollution is complex and can cause both short and long-term health problems. The most commonly associated conditions with air pollution are respiratory conditions, such as asthma, cardiovascular disease and lung cancer. However, associations between other conditions such as low birth weight in babies, Type 2 diabetes and dementia have been linked with air pollution, the far-reaching impact is becoming more apparent as evidence emerges.
There is a link between socio-economic deprivation and poor health outcomes due to air pollution which contributes to local health inequalities.
The key pollutants in London which impact on health particularly are nitrogen oxides (NOx), particulate matter (PM) 10 and 2.5 and carbon dioxide (CO2). NOx is a combination of highly reactive gases which form when fuel is burned at a high temperature, it is emitted by fossil fuel vehicles and construction equipment, and industrial sources such as power plants. It impacts on respiratory conditions causing inflammation of the airways at high levels, long-term exposure can decrease lung function and increase the risk of respiratory conditions. PM is often classified into PM10 and PM2.5. These are complex mixtures of non-gaseous particles of varied physical and chemical composition. It is categorised by the size of the particle (for example PM2.5 are particles with a diameter of less than 2.5 microns, a human hair is 70 to 90 microns in diameter). PM, and especially PM2.5, can penetrate and lodge deep inside the lungs. Chronic exposure to particles contributes to the risk of developing cardiovascular and respiratory diseases as well as lung cancer. It can also make asthma and COPD worse.
Manmade carbon dioxide (CO2) is a gas which is released when burning fossil fuels. It is associated with climate change in terms of health frequent and prolonged exposure at high concentrations such as near busy roads. This can cause inflammation of the lungs leading to wheezing, coughing and difficulties with breathing.
Exposure to air pollution is a risk factor for many different respiratory conditions in children, associations have been shown between air pollution and various forms of asthma, A&E attendances, missed school and steroid dependency due to childhood asthma. Children are more at risk of the detrimental impact of air pollution as their lungs are still developing, and children take more breaths per minute than adults. A study in 2019 estimated that approximately 29% of new cases of childhood asthma in London were attributable to air pollution 2.
Air quality is a London wide issue with Inner London Boroughs like Wandsworth affected disproportionally. Locally 6.5% of mortality can be attributed to air pollution, this is higher than England but similar to London. Since 2010, the Borough has seen a decrease in emissions of CO2, NOx and other pollutants. The largest sources of pollution locally are road transport, construction, and industrial and domestic health and power.
Around half of London’s air pollution is caused by road transport 3. Toxic fumes from vehicles cause thousands of premature deaths every year, and lead to young Londoners growing up with stunted lungs and asthma. Wandsworth is home to seven Air Quality Network pollution analysers: Battersea, Lavender Hill, Putney, Putney High Street, Putney High Street Façade, Tooting High Street and Wandsworth Town Hall.
The table below provides emission estimates of key pollutants, NOx, PM10, PM2.5 and CO2 in Wandsworth, between the years 2010 to 2019) 4. The LAEI (London Atmospheric Emissions Inventory) estimates emissions of these key pollutants by source type. In their 2016 report they found that there were 80,900 people in Wandsworth exposed to an annual average NO2 concentration that is above the Air Quality Strategy objective of 40µg/m3, based on the modelled 2016 ground level concentrations. This makes up 26% of the population, which is lower than Inner London (48%) but much higher than Outer London (3%) and a little higher than Greater London (24%).
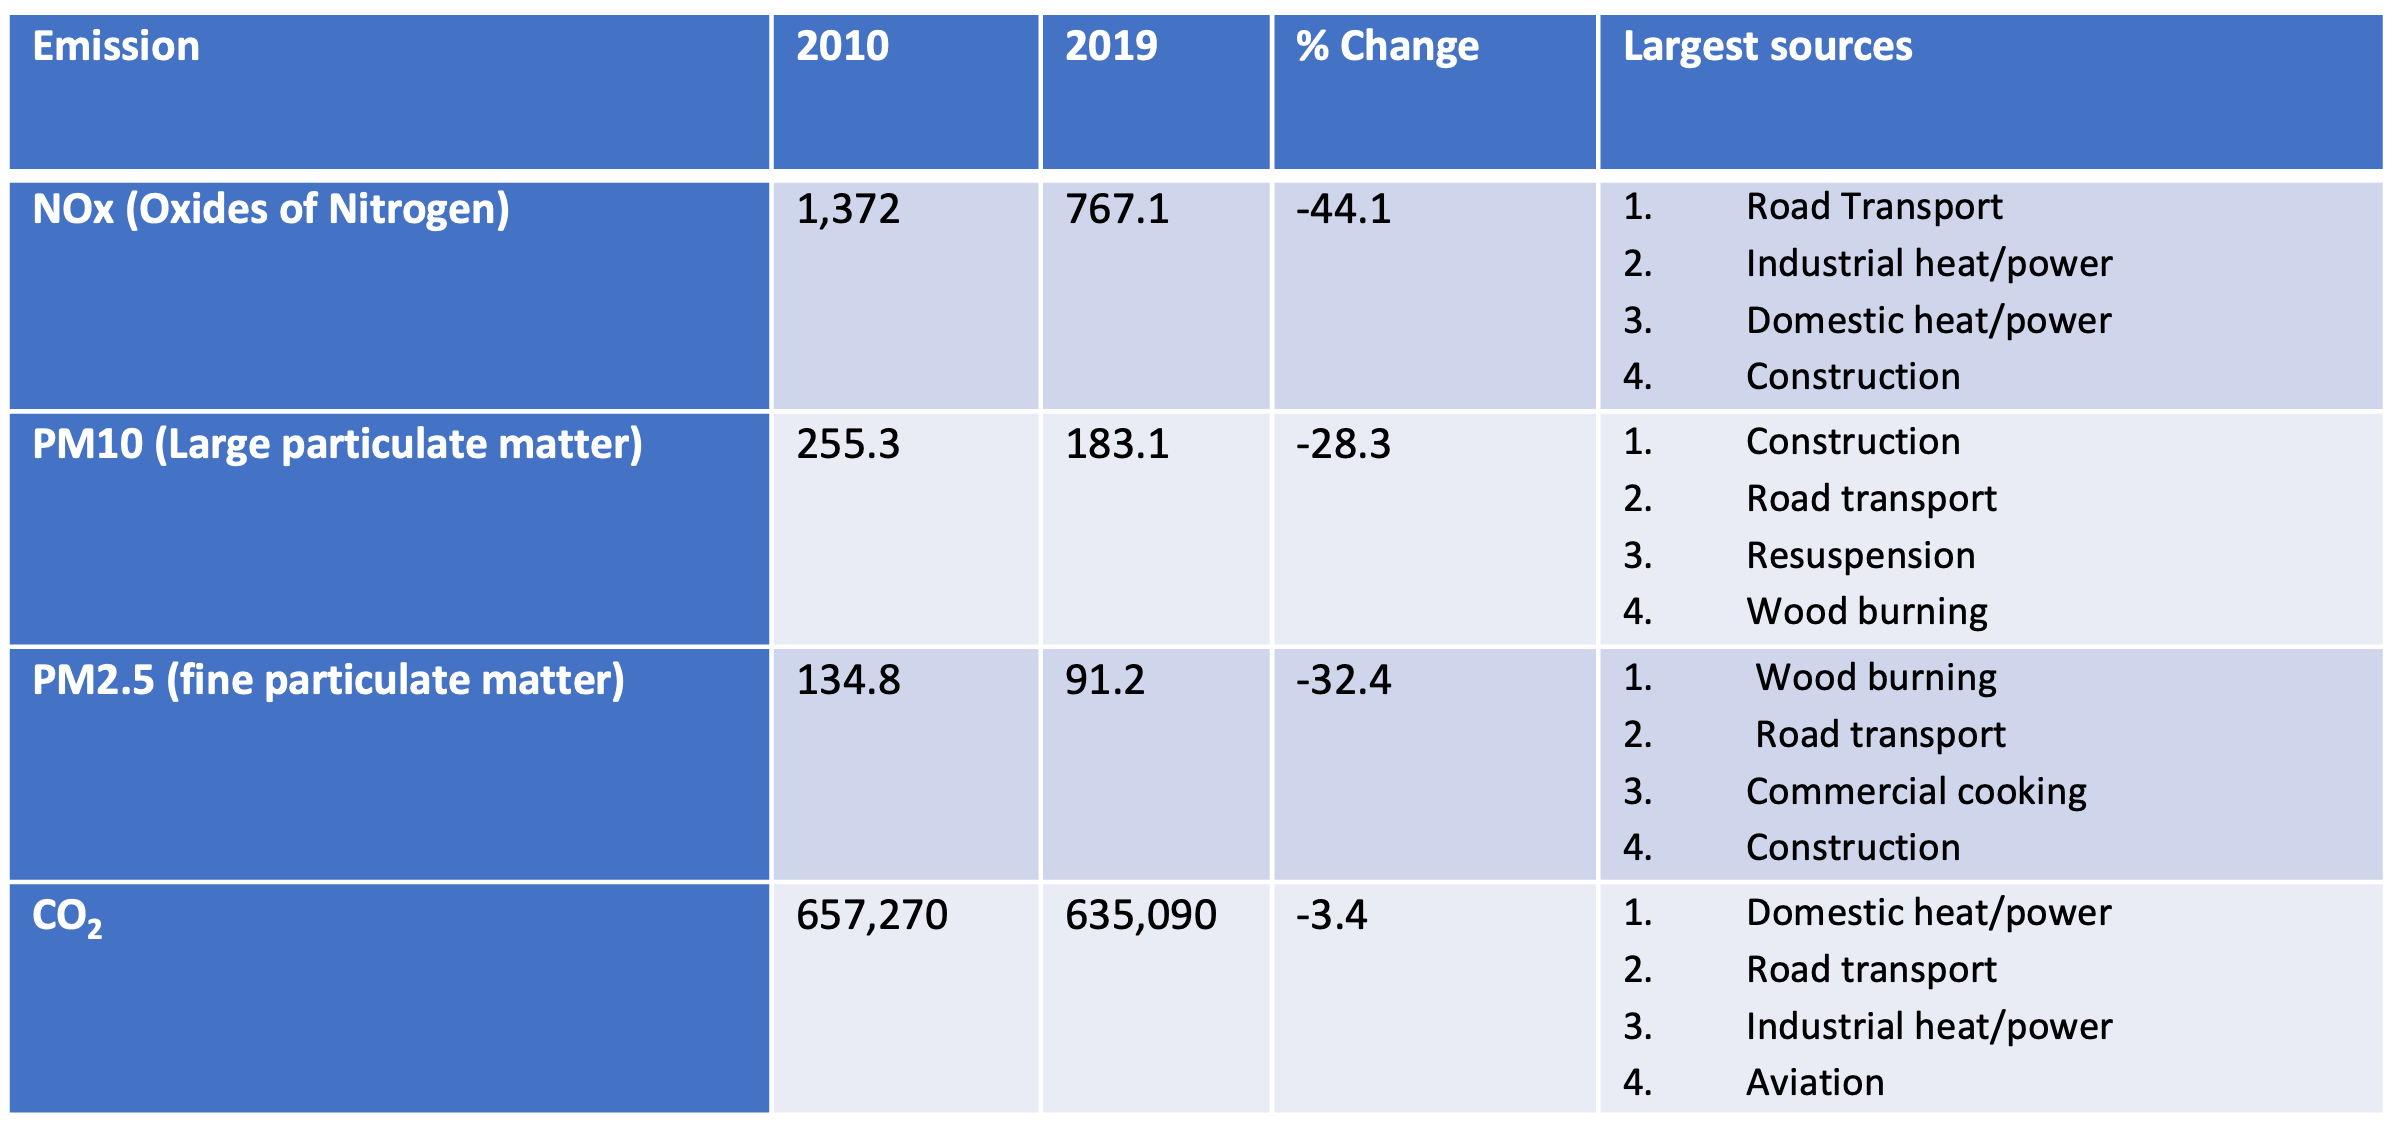
Source: London Data Store - LONDON ATMOSPHERIC EMISSIONS INVENTORY (LAEI)
Out of the 61 primary schools in Wandsworth, 13% (8) of these are located in areas of high air pollution which exceed the NO2 Annual Mean UK Air Quality Strategy limits. This is lower than the total percentage of all primary Schools in London exceeding this metric (20%) . Out of 12 secondary schools in Wandsworth, 17% (2) were exposed to NO2 concentrations in their localities above the air strategy concentration of 40µg/m3.
A selection of local maps with NO2, NOx, PM10 and PM25 and an accompanying dashboard can be found on London Datastore in Borough specific air quality packs.
Air pollution: estimated fraction of mortality attributable to particulate air pollution: In 2023, Wandsworth’s rate was 6.2%, which was the 15th lowest in London, 18.1% higher than the England average and 0.3% lower than the London average. The latest Borough figure for 2023 was also 32.1% lower than in 2018, in comparison with 26.1% decrease in England’s rate in the equivalent time period.
Source: OHID: Public Health Profiles
Source: OHID: Public Health Profiles
Fine particulate matter
Air pollution: fine particulate matter (new method - concentrations of total PM2.5): In 2023, Wandsworth’s rate was 8.3 µg/m3, which was the 15th lowest in London, 18.6% higher than the England average and 0.3% lower than the London average. The latest Borough figure for 2023 was also 33.2% lower than in 2018, in comparison with 26.9% decrease in England’s rate in the equivalent time period.
Source: OHID: Public Health Profiles
Source: OHID: Public Health Profiles
Vehicle ownership and traffic
The number of resident vehicles and traffic has been decreasing. Fewer households have cars because residents are taking public transport to reach work location, a preferred option compared to using cars and finding parking spaces.
According to the 2011 Census, 45% of Wandsworth households did not have access to a car or van. The proportion of one car households in Wandsworth (43%) was similar to London (41%) and England (42%). The households with multiple cars were much less common in Wandsworth (12%) compared to London (18%) and England (32%).
Car registrations and miles travelled are declining, which will positively impact the local air quality:
- In 2018, 580 million kilometres were travelled on local roads by cars in comparison to 832 million in 2000. This was a decrease of 30%, the third sharpest decrease in London 5
- In 2018 there were 81,981 private or light good vehicles registered in Wandsworth compared to 122,920 in 2000, a decrease of 33%. This was the second largest decrease in London after the City of London 6.
2.2 Climate Change
The overwhelming scientific and political consensus is that human-driven climate change is real, its impacts are already being felt and unless action is taken immediately to address the drivers of climate change then there will be huge impacts on the environment and on society globally.
The International Panel on Climate Change (IPCC) has, since 1988, spelled out the climate science, highlighting that greenhouse gas emissions must be drastically reduced in order to avoid a global increase in temperature above 2 °C. The UN Framework Convention on Climate Change, signed in Rio in 1992, set limits on greenhouse emissions. This was followed with the 1997 Kyoto Protocols and 2015 Paris Agreement, setting further binding targets on reducing greenhouse gas emissions. The Katowice Climate Change Conference in December 2018 and the IPCC Special Report on Global Warming of 1.5 °C highlighted that the lack of sufficient action over the past 30 years means that immediate action must be taken to prevent a global temperature increase of 1.5 °C. The UK Government amended its Climate Change Act in June 2019 to introduce a legally binding zero carbon target by 2050.
Data on climate change and Wandsworth
Carbon dioxide (CO2) is the most common greenhouse gas emitted by human activities in terms of the quantity released and the total impact on global warming. In 2017 this accounted for 81 per cent of the UK greenhouse gas emissions (GHG) . As a result, the term “CO2” or “carbon” is sometimes used as a shorthand expression for all greenhouse gases.
The Department for Business, Energy & Industrial Strategy (BEIS) produces a breakdown of carbon dioxide emissions by Local Authority area as a subset of its annual inventory of greenhouse gas emissions. This publication combines data from the UK’s Greenhouse Gas Inventory with data from a number of other sources, including local energy consumption statistics, to produce a nationally consistent set of carbon dioxide emissions estimates at Local Authority level from 2005 to 2017 7.
The data shows emissions allocated on an “end-user” basis where emissions are distributed according to the point of energy consumption (or point of emission if not energy related). Except for the energy industry, emissions from the production of goods are assigned to where the production takes place. Therefore, emissions from the production of goods which are exported will be included, and emissions from the production of goods which are imported are excluded.
The BEIS data (the figure below) shows Wandsworth’s per capita emissions have almost halved over the past 12 years, from 5.2 tonnes per capita in 2005 to 2.7 tonnes per capita in 2017.
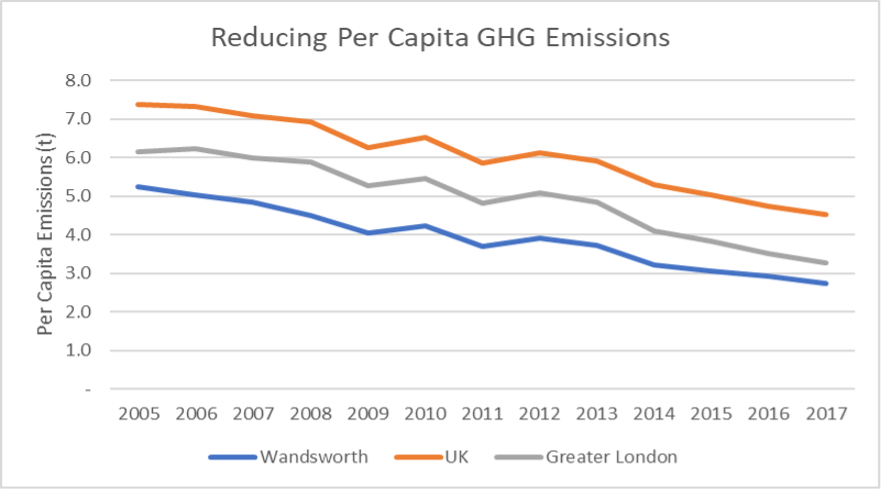
Source: BEIS
This is in comparison with a reduction from 6.2 tonnes per capita in 2005 to 3.3 tonnes per capita in 2017 for Greater London, and a reduction from 7.4 tonnes per capita in 2005 to 4.5 tonnes per capita in 2017 for the UK.
The BEIS data also offers a sectoral analysis which shows that 47% of emissions for the Borough originate from domestic sources, including domestic electricity and gas usage (the figure below).
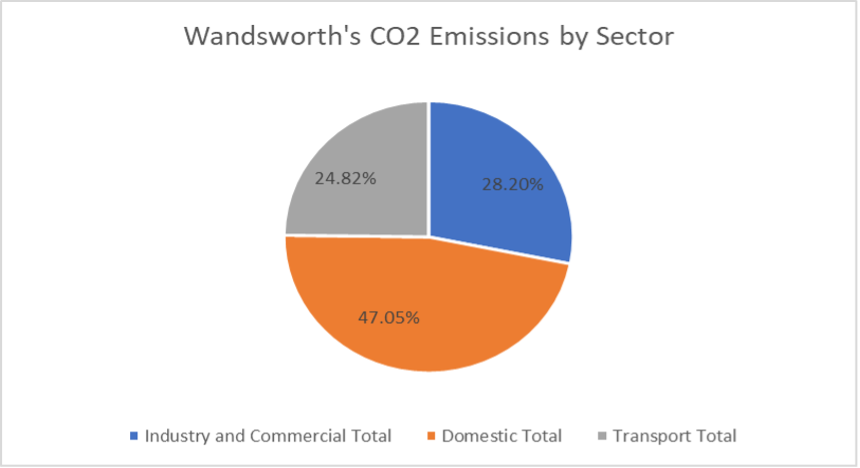
Source: BEIS data
By analysing different sectoral reductions between 2005 and 2017 it is possible to see the largest quantities of emissions reduction came from Industry and commercial electricity use (62.8% reduction), and domestic electricity use (53% reduction). Together, these account for 60.4% of the carbon reductions for Wandsworth according to BEIS data. This can be attributed to the progress that has been made in the decarbonisation of the national electricity supply.
Wandsworth Council monitors and reports on its emissions. These are published as part of the annual updates with the Wandsworth Environment and Sustainability Strategy.
Tackling climate change in Wandsworth
On 17th July 2019, Wandsworth Council declared a climate emergency, setting a target to be a carbon neutral organisation by 2030. In January 2020, Councillors in Wandsworth approved an Annual Action Plan, which set out a series of actions to deliver the ambitious ten-year Wandsworth Environment and Sustainability Strategy (WESS).
The Strategy addresses specific areas of action that the Council needs to pursue, including:
- making Wandsworth the greenest Inner London Borough by committing the Council to urban greening, planting trees, encouraging biodiversity, protecting and enhancing existing open and green spaces
- ensuring that the Council’s planning and development approach is robust on requirements around climate change and environmental issues so that development in the Borough is low carbon, sustainable and does not negatively impact on the environment
- drastically reducing the amount of waste produced as an organisation and enhancing the Council’s community leadership role to help and support residents and businesses to regularly reduce, reuse, and recycle
- improving the Council’s fleet of vehicles by first making them Ultra Low Emission Zone (ULEZ) compliant and then moving to renewable fuel sources
- encouraging micro-mobility, such as car sharing, electric scooters and cargo bikes, fulfilling the commitment to improve the electric vehicle infrastructure; and making Wandsworth the easiest place in the country to run an electric car
- setting stringent targets around improving air quality
- reducing the amount of energy used as an organisation; improving the energy efficiency of housing stock ; and helping residents become more energy efficient
- refurbishing Wandsworth Town Hall will be a flagship building for energy efficiency whilst respecting its listed status, highlight the Council’s eco-credentials
- reducing pollution entering the Thames, especially plastics, ensuring the shore of the Thames is clean
- building the principles of sustainability in the way goods and services are procured, and encouraging the Council, staff, contractors, and suppliers to improve their own environmental performance.
In order to deliver the Strategy, an Annual Action Plan has been produced, aiming to reduce the Council’s emissions, support the reduction of the Borough’s emissions, and deliver the strategic aims. This plan sets out the benefits of actions including their impact on air quality. The 2021 Action Plan can be found here . The Strategy and the Action Plan are delivered by Officers across the Council who are supported by a dedicated Climate Change Policy Team.
To maintain the rapid pace needed to deliver climate change an Annual Update is published which can be found here.
Whilst the target to be carbon neutral is specific to the Council’s operations, the Strategy and the Annual Action Plan include actions to support residents and businesses reduce their emissions. The Strategy is supported by an in-depth, innovative engagement and behaviour change programme, which supports residents, businesses and partners to improve the environment and reduce emissions. In 2020 a key example of this work was the Wandsworth Climate Summit, attended by over 650 residents.
The work planned and delivered through the Wandsworth Environment and Sustainability Strategy is linked with action to improve air quality , travel and parks.
There are strong links between reducing energy usage and tackling fuel poverty. In order to support residents to make their homes more energy efficient the Council successfully bid for Green Homes Grant funding in 2020 and 2021.
2.3 Built Environment
Where we live influences our health. The built environment is human-made and provides a setting for working, living and playing. These settings range in scale from park, houses, factories to highways. Healthy built environments are walkable and bike-able, include access to diversity of essential and desired services, green spaces, and places for people to meet and mingle. These environments influence the physical and mental health of the local population, making healthy life choices easier including exercise, walking, healthy food options, and cycling.
Wandsworth is an Inner London Borough with 20 wards covering an area of 13.23 sq. miles. The Borough has over 30 parks covering a fifth of the area. If you include all green spaces, a quarter of the Borough is covered in green spaces. The Borough also has 5 miles of river front. With the Borough’s good transport links to central London, Wandsworth benefits from proximity to central London but with more accessibility to open space and balance of high rise and low-rise buildings.
The Borough has 5 vibrant town centres including Balham, Clapham Junction, Putney, Tooting and Wandsworth Town. There are large housing and business developments in Wandsworth Town, Battersea and Nine Elms. There is further regeneration on Winstanley and York Road, and Alton Estates. Wandsworth is one of the top Boroughs with over 20 kilometres of high street spread across the Borough 8.
The Borough is well connected to central and other parts of London through public transit. Around two-thirds take public transportation to work. Less than 1 in 6 drive to work, car ownerships have been decreasing in the Borough with almost half the households not having access to a car.
Healthy streets
The London Boroughs’ Healthy Streets Scorecard is designed to measure progress towards meeting the Mayor’s Transport Strategy ‘healthy streets’ targets. The scorecard considers sustainable travel, road safety, road characteristics, and traffic. Wandsworth ranks 13th out of 32 London Boroughs on the healthy streets Scorecard and ranks 11th out of 13 Inner London Boroughs 9.
Housing
There are 147,970 properties in Wandsworth. The median price of a property is £618,500. Most properties in Wandsworth are flats or maisonettes (69%) which is higher than the London average (55%) and over double the national average (23%). Terraced houses make up 24% of the dwelling types in Wandsworth, while semi-detached houses constitute for 4% and detached houses account for only 1% of the borough 10.
Home ownership is associated with increased life satisfaction, however only 18% of Wandsworth residents own their home outright compared to 21% for the London average. The average price of a property in Wandsworth has grown by 4% from £587,915 in 2019 to £613,448 in 2020, which is a slightly higher increase when compared to London and England (3%). This makes it increasingly difficult for first-time buyers to get on the property ladder.
Almost a third (32%) of residents rent privately, which is higher than the inner London average (29%). The median monthly rent is around £1,828 which is higher than the London average (£1,727) and more than double the England average (£858). This is estimated to be approximately 53% of a Wandsworth resident’s median income (£41,100), meaning that the private sector housing remains unaffordable to most people on lower incomes 11.
Housing estates cover 10% of the area of the borough, and social housing accounts for 19% of property. In 2019/20 there were 29,922 social housing properties, of which 16,890 were council tenanted properties and 13,032 were registered provider social rented properties.
Tenure: In Wandsworth, the majority of residents own their property and two-fifths rent 12. In 2018, almost 17% owned their home outright, similar to the Inner London Boroughs but much lower than the London average. However, a higher rate of residents owned their property with a mortgage compared to the inner London and London averages.
Locally, the proportion of those who rent from the council or housing association (16.0%) is about half as much as Inner London (30.9%). Since 2010, the proportion owning with mortgage has increased whilst the percentage of residents renting privately has decreased. Owning with a mortgage is much higher in Wandsworth compared to London and Inner London (as shown in the table below).
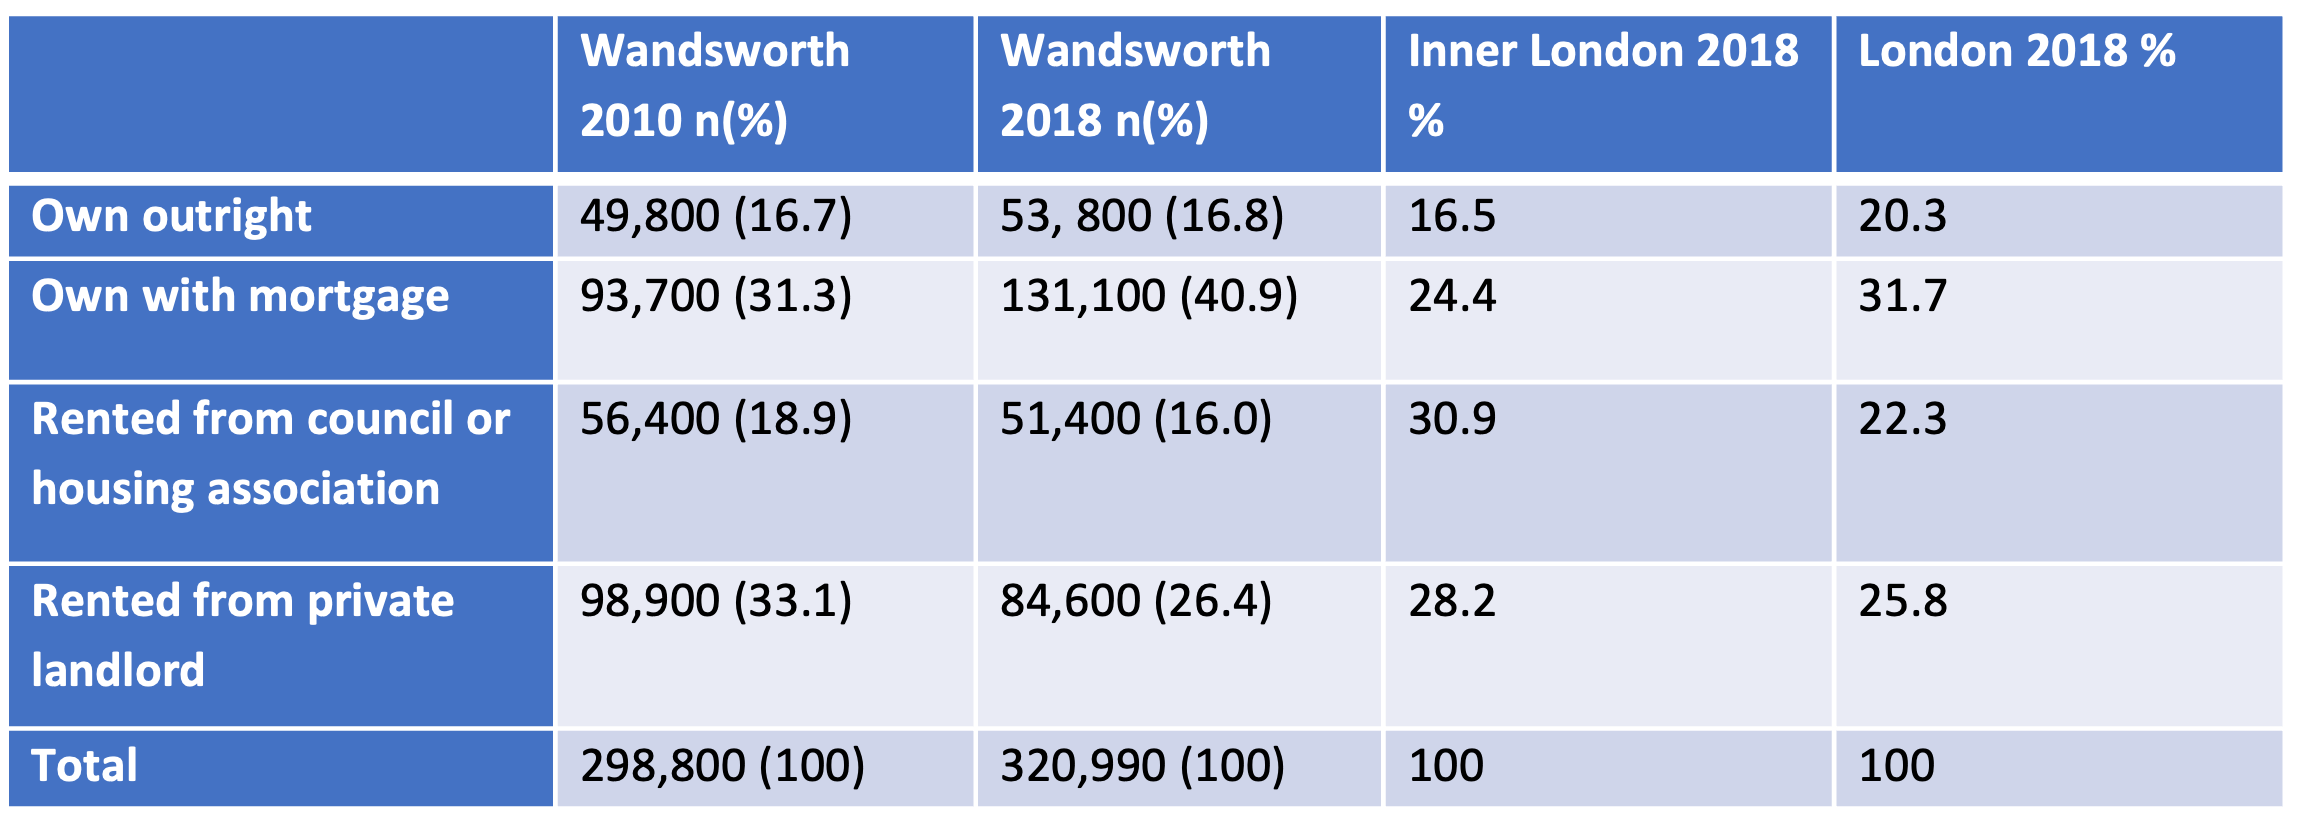
Source: ONS via GLA London Datastore
Addressing housing needs
Affordable housing through council-led development
The council’s affordable housing has been progressing well: - 31(14) new homes completed in 2019/20 - 194 (174) further homes are under construction, of which 70 (64) are due to be completed in 2020/21 - 46 have secured planning consent - A further 210 (241) have had planning applications submitted or are due to have planning applications submitted for 2020/21
Regeneration Projects
Alton Regeneration A planning application was submitted for over 1,100 new homes in June 2019. Following comments received from local residents, the GLA and TFL a revised application was submitted in March 2020. Consultation on these revisions commenced in May 2020 (delayed due to COVID-19) and is due to run until July 2020. In September 2019 work commenced on a development in Bessborough Road on the Alton estate, which will deliver 10 new council homes.
Winstanley and York Road In January 2020 Wandsworth council’s planning committee approved the Winstanley and York Road Regeneration scheme. The first phase of the scheme includes the new community hub incorporating the new leisure centre with swimming pools, the improved library and children’s and community centres as well as 502 homes of which 35% are affordable. They also started on site with phase 0 which will provide 46 replacement and homes.
Covid-19 and Housing
The ongoing impact of the coronavirus outbreak continues to affect how Wandsworth council provides services to tenants and keep them safe.
Covid-19 has had a serious impact on the issuing and enforcement of evictions. Due to changes in government legislation in response to the pandemic, the eviction of tenants and homeowners was suspended in March 2020 and will not be lifted until after 31st May 2021. This protocol aims to provide greater protection to tenants during the economic uncertainty of this period; to prevent the threat of homelessness and limit the spread of infection. Evictions can only take place in exceptional circumstances, for example if a resident has committed serious ASB (Anti-Social Behaviour), as a court order is required to carry out an eviction.
Wandsworth Council has not enforced any evictions during this period (March 2020 to April 2021). From April to June 2020, following the first national lockdown, the number of repairs orders raised to Wandsworth Council dropped by 48%. However, despite the introduction of a further national lockdown, the number of orders steadily increased back to normal levels from July to December.
As a result of the Coronavirus outbreak, many victims of domestic abuse have faced additional challenges and barriers to accessing support. While self-isolating, families have had to spend extended periods of time with abusers which has escalated the threat of violent and abusive behaviour. Domestic violence in the Wandsworth borough saw an increase of 22% from 2019 to 2020. Domestic abuse is often a hidden crime that is not reported to the police. Therefore, the number of reports can only provide a partial picture of the actual level of domestic abuse experienced in the borough.
2.4 Noise Pollution
Noise pollution is defined as regular exposure to elevated sound levels that may lead to adverse effects. Exposure to hours of constant noise beyond 85 dB may be hazardous.
The percentage of the population exposed to road, rail and air transport noise of 65dB(A) or more, during the daytime: In 2021, Wandsworth’s rate was 13.0% (n=42990), which was the 10th highest in London, 200.4% higher than the England average and 15.2% higher than the London average. The latest Borough figure for 2021 was also 6.6% lower than in 2006, in comparison with 19.9% decrease in England’s rate in the equivalent time period.
Source: OHID: Public Health Profiles
Source: OHID: Public Health Profiles
The percentage of the population exposed to road, rail and air transport noise of 55 dB(A) or more during the night-time: In 2021, Wandsworth’s rate was 19.4% (n=63940), which was the 12th highest in London, 130.4% higher than the England average and 7.0% higher than the London average. The latest Borough figure for 2021 was also 0.9% lower than in 2006, in comparison with 34.0% decrease in England’s rate in the equivalent time period.
Source: OHID: Public Health Profiles
Source: OHID: Public Health Profiles
The rate of complaints about noise: In 2023/24, Wandsworth’s rate was 13.8 per 1,000 (n=4578), which was the 13th highest in London, 134.4% higher than the England average and 7.5% lower than the London average. The latest Borough figure for 2023/24 was also 15.2% lower than in 2010/11, in comparison with 24.3% decrease in England’s rate in the equivalent time period.
Source: OHID: Public Health Profiles
Source: OHID: Public Health Profiles
2.5 Natural Environments
Green space promotes active living and provides important physical, psychological and social health benefits for individuals and the community. Publicly accessible parks including regional, metropolitan, district, local, small, and pocket parks, make up almost a quarter (27%) of the total area of Wandsworth 13.
There are 32 public parks in the Borough including Wandsworth Common, Tooting Bec Common, Wandle Valley, and Battersea Park. The Borough also has five miles of Thames River frontage. There are ten allotment sites in Wandsworth. Eight are managed by Enable Leisure and Culture on behalf of Wandsworth Council. Two are managed by Roehampton Garden Society (RGS).
Biodiversity can increase the benefits that people enjoy from nature. There are 1,600 different species recorded within 27 different habitat types Several rare and endangered species can be found in Wandsworth including peregrine falcons, black redstarts and stag beetles 14.
In Wandsworth, 24.4% (76,875) of residents had access to woodland, much higher than London (12.9%) and England (16.8%). 19.8% of residents reported using outdoor space for exercise and health reasons (London=18.0%, England=17.9%).
3. Healthy Neighbourhoods
The place in which we live influences every aspect of health and well-being. Physical, mental, social and emotional health can all be influenced by the environment. Access to local community facilities, services, shops and meeting places is important in facilitating social interaction and general community well-being and happiness. In line with policy Local Plan 28 in 8.1 ‘Social and Community Infrastructure’, co-location of community facilities, such as healthcare services and leisure centres, is encouraged.
3.1 Access to Healthy Assets
The Access to Healthy Assets and Hazards Index
The Access to Health Assets and Hazards (AHAH) index from the Geographic Data Science Lab is designed to measure the health of neighbourhoods. The index is multi-dimensional with data being drawn from several sources and used to create an overall AHAH index including four constituent domains:
- Retail Environment Domain: proximity to fast food outlets, gambling outlets, pubs/bars/nightclubs, off-licences, tobacconists
- Health Services Domain: proximity to GPs, hospitals, pharmacies, dentists, leisure services
- Physical Environment Domain: accessibility of passive and active green spaces including parks and recreational spaces; blue space including rivers, canals and lakes
- Air Quality Domain: level of nitrogen dioxide, particulate matter and sulphur dioxide.
The AHAH is produced for Lower Super Output Areas (LSOA) but when these measures are averaged across Local Authorities (LAs) Wandsworth ranks within the bottom 10% (307/326) of all LAs in England. Although the Borough has good access to healthy lifestyle choices, ranking within the top 5% of LAs for Physical Environment (9/326) and Health Services (11/326). However, it also has access to unhealthy environments, ranking within the bottom 5% of LAs in the Retail Domain (316/326) and the bottom 10% of LAs in the Air Quality Domain (307/316).
Health Care
Whilst the largest contribution to our health is made by social, economic and environmental factors, access to healthcare is important in maintaining the health of the population.
The Borough has a range of health care assets :
- There are 71 pharmacies and 53 GP practices and 13 health centres. 96% of the population has access to a GP by 15 minutes of walking or public transport. There are also 54 dental services and 25 optician Services
- St George’s Hospital is a large Teaching Trust which provides community services to residents of Wandsworth, local hospital services and specialist services
- Queen Mary Hospital provides various community, clinical health and non-emergency medical services
- Royal Hospital for Neurodisability which provides rehabilitation and long-term care for people with complete neurological disabilities
- There are 33 residential and nursing care homes in the Borough.
London Output Area Classification
London Output Areas Classifications (LOAC) are based on 60 variables from the 2011 Census and help to summarise the sociodemographic characteristics of an area.
The table below demonstrates the differences between Wandsworth, Inner London and Greater London with respect to the major classification categories. Out of the total 982 Output Areas in Wandsworth, 74% fall within the London Lifecycle, City Vibe and Urban Elites categories. The descriptions below explain the key attributes of these classifications. Please note that these are area-based classifications that provide a broad overview, they will not apply to every individual.
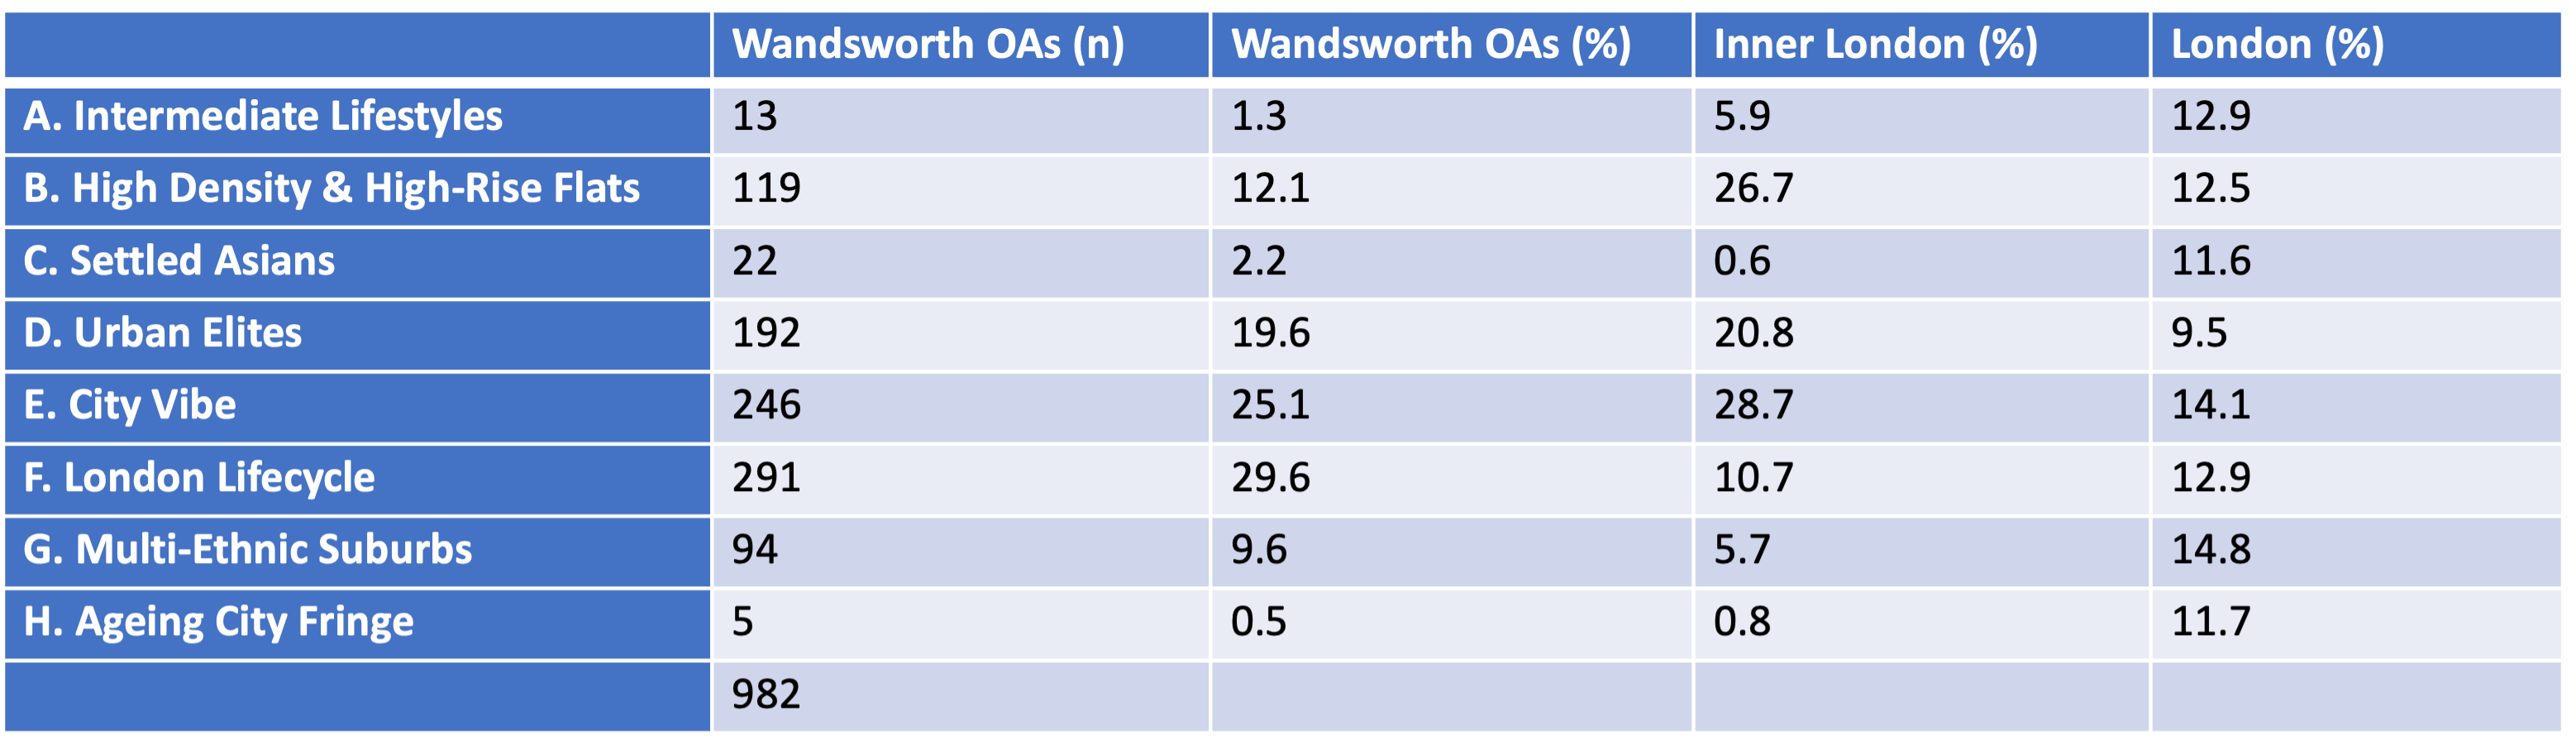
Source: London Datastore, London output area classifications
Compared to London, Wandsworth has a lower proportion of areas classified as Intermediate Lifestyles, Settled Asians and Ageing City Fringe, but a higher proportion of Urban Elites and City Vibe (as shown below). The Borough also has a greater presence of London Lifecycle compared to both London and Inner London and a notably lower presence of High Density & High-Rise Flats for an Inner London Borough. The exclusions and inclusions of characteristics across these groups point towards Wandsworth having a young, diverse, well-educated and professionally employed population. The descriptions for top 3 dominant OA types in Wandsworth can be found below.

Source: London Datastore, London output area classifications
Workplace Zones
The following analysis is extracted from the 2021 Census based on the workplace population. The workplace population in a Local Authority is defined as the population whose usual place of work is in that Local Authority, including both individuals who live and work in the Local Authority and individuals who work in the Local Authority from a home elsewhere within England.
The Borough has a lower proportion of infrastructure support and city focus which includes manufacturing and transport services (as shown in the table below) 15.
Source: GLA Datastore hosts an interactive visualization tool.
Local Business Employers
In 2021, Wandsworth was home to 18,625 local business units 16; of which 93.7% were micro (employing less than 10 employees) and 0.2% are large companies (employing over 250 employees). Of those enterprises that formed in 2012, 40% survived up to 5 years.
Additional information on local business and employers can be found on DataWand:
- By industry, the largest number of enterprises in Wandsworth are professional, scientific and technical (n=5,225; 30.7%), information and communication (n=2,410; 14.2%), and business administration & support services (n=1770; 10.4%).
- Gross Value Added (GVA) is the measure of the increase in value of the economy due to the production of goods and services. The Borough’s total GVA in 2017 was £12,916 million. The largest industry group is real estate which contributed £4,941 million to the total GVA.
- Apprenticeships are paid jobs that incorporate on-and off-the-job training leading to nationally recognised qualifications. Apprentices can earn as they learn and gain practical skills in the workplace. Apprenticeships achieved refers to the number of apprenticeships successfully completed. In 2017/18, 31.9% of Wandsworth’s apprenticeships were achieved in Health, Public Services and Social Care, 27.7% were achieved in Business, Administration and Law while 17% in Retail and Commercial Enterprise.
Out of Home Meals and Food Environment
Wandsworth has a Local Plan Policy which seeks to restrict the number of hot food takeaways within 400m of state schools or colleges where this could undermine their healthy eating initiatives 17. The Local Plan was adopted in 2016. The latter clause was the key to the Planning Inspector agreeing that a land use policy is justified ( as a land use intervention) to assist in the implementation of school healthy eating plans. It was based on Government guidance “Healthy Weight, Healthy Lives: A Cross Government Strategy for England” which aims to promote healthier communities and encourages Planning Authorities to manage the proliferation of fast food outlets, acknowledging the need for a holistic approach to healthy communities. We also noted at the time that other Boroughs had successfully taken through Examination Local Plan Policies controlling hot food takeaways around schools.
The policy was supported by evidence produced by Public Health Wandsworth at the Local Plan Examination. The policy is supported by a contextual paragraph in the plan, and by more detailed guidance in the Town Centre Uses Supplementary Planning Document 18 to assist in the implementation of the Policy. The SPD sets out more detail with schools’ healthy eating plans and provides more information to assist in decision making. It shows a Borough-wide map (extract below) where schools are plotted with a 400m buffer around them.
This information was mapped on our Geographic information Systems, (GIS) allowing analysis and correlations with census data.
Current national planning policy and guidance continues to identify the need for planning authorities to work with stakeholders to achieve public health outcomes. This approach has been successfully taken forward by other London Boroughs, including Lambeth with which Wandsworth shares 2 local centres - around Lavender Hill/Queenstown Road and at Clapham South (District centres in Lambeth). A joint approach to using these Centres should be agreed. Planning’s role in supporting public health initiatives is set out in National Planning Guidance (NPPG 2019) which clarifies ” Planning and health needs should be considered together in two ways: creating environments that support and encourage healthy lifestyles, and identifying and securing the facilities needed for primary, secondary and tertiary care, and the wider health and care system.
Engagement between plan-making bodies and related organisations will ensure local strategies to improve health and well-being and the provision of the required health infrastructure are supported. It is worth noting public health has been identified as a sustainability issue in the Scoping Report and is one of the 20 sustainability objectives against which new policy options will be assessed.
3.2 Transport and Modes of Travel
Wandsworth is a well-connected Borough with lower levels of car ownership. The majority of residents take public or active models of transportation to work, mainly to the City, Westminster and Canary Wharf.
Lower use of cars and lower volumes of traffic are better for air quality. Use of sustainable modes such as trains, buses, the underground, cycling and walking are associated with more physical activity and lower BMI.
The Borough’s transportation assets include the District and Northern line, bike hire schemes, various train services, Clapham Junction, the River Bus Service. and the imminent extension of the Northern Line. Furthermore, major roads running through the Borough include the A3, A24, A214 and A205. There are also five bridges that allow easy access between the south and north of the river.
Modes of Travel to Work
In 2021, there were an estimated 108,000 people in Wandsworth who worked mainly at, or from, their homes. This figure was 56.5% of all usual residents aged 16 years and over in employment, in comparison with the London average of 42.1% and the England average of 31.5% 19.
Fewer than 1 in 10 Wandsworth residents in employment drive to work in a car or a van, the vast majority take public transport to work, as shown in the figure below.
Source: ONS. Travel to work, England and Wales: Census 2021
While Wandsworth is well connected, it has the third lowest Public Transport Accessibility Levels in Inner London 20. Access is also variable across the Borough. Access to frequent and a variety of transport is higher along the river and the Northern line corridor 21. Public transport use is likely to be even higher with improved availability.
Vehicle Ownership and Traffic
Road traffic and the number of vehicles in Wandsworth are decreasing. Fewer households have cars because people are taking public transport to reach work locations better served by this option compared to driving and parking.
According to the 2011 Census, 45% of Wandsworth households did not have access to a car or van. The proportion of one car households in Wandsworth (43%) was similar to London (41%), and England (42%). The households with multiple cars were much less common in Wandsworth (12%), compared to London (18%) and England (32%).
Car registrations and miles travelled are declining which will positively impact the local air quality.
- In 2018, 580 million kilometres were travelled on local roads by cars vs. 832 million in year 2000, a decrease of 30%; this was the third sharpest decrease in London 22.
- In 2018, there were 81,981 private or light good vehicles registered in Wandsworth compared to 122,920 in year 2000, a decrease of 33%. This was the second largest decrease in London after the City of London 23.
Active Travel
People who commute actively by cycling or walking tend to have greater levels of physical activity 24 than those who travel by car. This complements findings that active travel reduces the risk of morbidity and mortality from chronic diseases 25. Walking and cycling can also mitigate the harmful effects of motorised travel, such as traffic congestion, air pollution 26, and health problems 27.
There is an urgent requirement to consult and co-produce a Wandsworth Active Travel Strategy. Active travel is even more important in response to the pandemic and climate emergency, declared by the Council in 2020. An Active Travel Strategy should recognise that walking plays an important part in urban life and is part of almost all journeys, either complete or as a link between other modes of transport. In Wandsworth, the proportion of residents regularly undertaking travel by active methods (walking and cycling) is higher than the London average. Across London, the rate of active travel has been increasing steadily since 2006.
Wandsworth active travel should seek to apply for Transport for London’s Healthy Streets Approach 28. TfL’s two key action plans around walking and cycling include:
TfL’s Walking Action Plan
This plan 29 encourages walking through the following four themes:
- Building and managing walking friendly streets
- Planning and designing for walking
- Integrating walking with public transport
- Leading a culture change which encourages walking.
To get more people walking it is essential to create attractive places, facilitate better interchanges with public transport, and the promotion of walking.
TfL’s Cycling Action Plan
This plan 30 aims to increase the number of trips made by cycling and to expand the cycle network to reach more Londoners. The barriers outlined in the Richmond Active Travel Strategy highlight the importance of providing a safe, secure and continuous cycle network, and support and training to enable people to use the infrastructure. TfL’s Cycling Action Plan has four categories:
- Streets that enable cycling
- Making it easy to get around by bicycle
- Promoting cycling for all Londoners
- Wider action through the Mayor’s Transport Strategy.
The Council in developing its’ future Active Travel Strategy will consider:
supporting and promoting local walking and cycling trips, making them priority modes of travel along with buses as part of a Borough campaign and social movement approach
staff across social care and health to present active travel as a way for their clients and patients to improve their health and well-being
promoting greater and better connectivity
increasing the local cycle network by creating links between the zones as identified in the Cycle Network Review 31
creation of a third Local Implementation Plan (LIP) explicitly stating Wandsworth’ commitment to the delivery of outcomes included within the Mayor’s Transport Strategy (MTS)
A host of specific proposals to develop and support the infrastructure and wider system foster active travel for example:
- how to support local employers/ workplaces help and support their staff take up active travel in particular promoting the try before you buy scheme that could be supported through London Implementation plan for all employees and students in the Borough
- increase the Dr Bike scheme
- promote cycle safety and training
- ensure Active Travel is a key component of Active Wandsworth Strategy.
Road Casualties
Killed and seriously injured casualties on England’s roads: In 2023, Wandsworth’s rate was 324.8 per billion vehicle miles (n=147), which was the 10th highest in London, 253.6% higher than the England average and 73.2% higher than the London average. The latest Borough figure for 2023 was also 7.2% higher than in 2017, in comparison with 1.5% decrease in England’s rate in the equivalent time period.
Source: OHID: Public Health Profiles
Source: OHID: Public Health Profiles
Children killed and seriously injured (KSI) on England’s roads: In 2020 - 22, Wandsworth’s rate was 14.8 per 100,000 (n=24), which was the 5th highest in London, 10.2% lower than the England average and 31.0% higher than the London average. The latest Borough figure for 2020 - 22 was also 13.2% higher than in 2008 - 10, in comparison with 30.3% decrease in England’s rate in the equivalent time period.
Source: OHID: Public Health Profiles
Source: OHID: Public Health Profiles
4. Arts, Culture and Leisure
The World Health Organisation and the UK’s All-Party Parliamentary Group on Arts, Health and Well-being, have highlighted evidence that shows the symbiotic relationship between taking part in cultural and creative activities and improvements in health both mental and physical. Within London, University College London, UCL Institute of Health Equity’s research has demonstrated how after engaging with the arts, 79% of people in deprived communities in London ate more healthily, 77% of them engaged in more physical activity, and 82% enjoyed greater well-being 32.
Wandsworth’s Arts and Culture Strategy from 2021–31 sets out the council’s vision for the role of culture through seven goals including place-shaping, economic growth, communities and partnerships, learning and education, health and wellbeing, and sustainability of inspiration to support people to live healthy, fulfilled and independent lives. Within the health and wellbeing goal, the focus is on how the cultural sector will work with the Council’s Adult Social Care, Children’s Services, and the Health and Well-being Board to:
- ensure that all under 5s have access to creative play and cultural experiences to give them with best start in life
- linking with the Health and Care Plan’s start well theme to embed arts and culture in the support offered to young people
- linking with the Health and Care Plan’s live well theme to improve residents’ well-being through cultural engagement, including improving their happiness levels
- linking with the Health and Care Plan’s Age Well to improve cognitive functioning, communication, self-esteem, enjoyment of life, memory, and creative thinking, as well as facilitating and supporting intergenerational social contact
- develop partnerships with health service providers and universities to co-fund and deliver creative programmes and strategies
- develop a varied high-quality cultural prescription offer as part of a social prescribing model to support prevention and reduce residents’ need for medical interventions (such as mental health issues, dementia, reducing pain medication, or tackling obesity and loneliness)
- work with Adult Social Care, South West London Clinical Commissioning Group (CCG), and Public Health to develop cultural commissioning so that successful programmes can become sustainable and long term offers.

The new Arts and Culture Strategy defines culture as including dance, music, theatre, visual arts, combined arts, architecture, crafts, fashion, film, literature, museums, heritage collections and culinary art. It does not cover libraries, parks or sports but does link closely with libraries when they act as cultural hubs as well as the wide range of events and activities that take place in Wandsworth’s 32 parks. People will be encouraged to visit and enjoy these spaces.
Within Wandsworth, the majority of the population (87%) are culturally active but there are notable pockets within the Borough where (13%) residents have little cultural or creative engagement. The Council and Cultural Organisations are considering how they can engage these communities with mainstream cultural activities. Co-creation for developing cultural activities should support community cohesion. Specifically, this is approach is being undertaken on the Alton estate in Roehampton and on the Winstanley estate by Clapham Junction.
Social prescribing programmes often led to better results such as shorter period of illness, less need for medication, and saving the NHS money. A Wandsworth CCG report estimated that a pilot Wandsworth Community Arts Service working with 100 patients with mild and moderate mental health conditions (depression, stress and anxiety) could save the CCG at least £74,000 per year 33. Arts-on-prescription projects in other parts of the UK have led to 37% drop in GP consultation rates and a 27% reduction in hospital admissions, saving of £216 per patient. Wandsworth has a small number of programmes being delivered through St George’s Hospital such as Dance for Parkinson’s, theatre sessions for those with young onset dementia, dance for patients with a neurodisability at the Royal Hospital of Neurodisability in Roehampton, psychotherapeutic therapies (music, drama, art and play) to support mental well-being in young people and adults at the University of Roehampton’s Whiteland clinic. While Wandsworth introduced social prescribing, the aim is to further develop a sustained and strategic approach to support the whole health spectrum, from prevention, supporting people recovering from ill health, and helping people living with long term conditions.
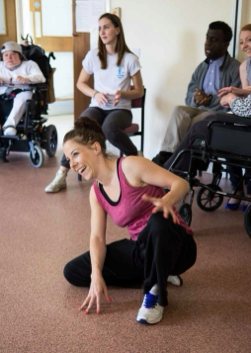
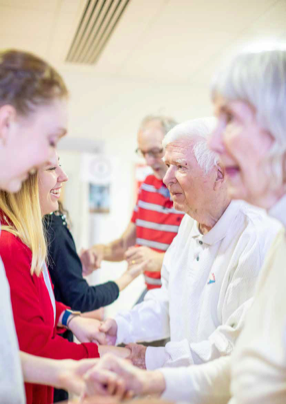 St George’s University
Hospitals NHS Foundation Trust has a strong arts offer, delivering a
wide range of engaging arts programmes to support patients, families and
staff. This photograph shows Dancing with Parkinson’s classes with
Danielle Teale Dance. Image Credit: Benedict Johnson Photography.
St George’s University
Hospitals NHS Foundation Trust has a strong arts offer, delivering a
wide range of engaging arts programmes to support patients, families and
staff. This photograph shows Dancing with Parkinson’s classes with
Danielle Teale Dance. Image Credit: Benedict Johnson Photography.
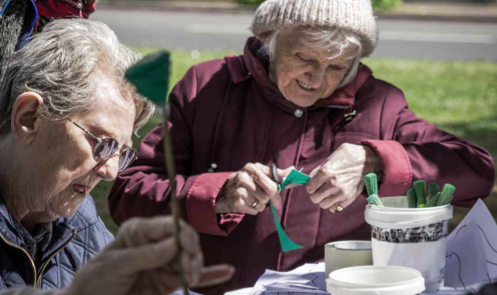
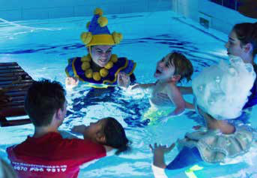
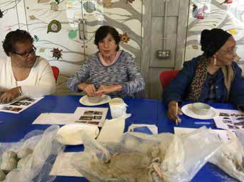 Putney School of Art
and Design (PSAD), managed by Enable Leisure and Culture, provide a
range of free outreach sessions to support people’s wellbeing such as
this session at the Katherine Low Settlement in 2018. Image courtesy of
PSAD.
Putney School of Art
and Design (PSAD), managed by Enable Leisure and Culture, provide a
range of free outreach sessions to support people’s wellbeing such as
this session at the Katherine Low Settlement in 2018. Image courtesy of
PSAD.
Cultural fixtures, arts, religious and leisure facilities have a positive impact on health and well-being of local communities. Wandsworth benefits from a range of events such as the Get Active Wandsworth Festival, Wandsworth Arts Fringe, Wandsworth Heritage Festival, Wandsworth Artists’ Open House and the Feel Good Festival.
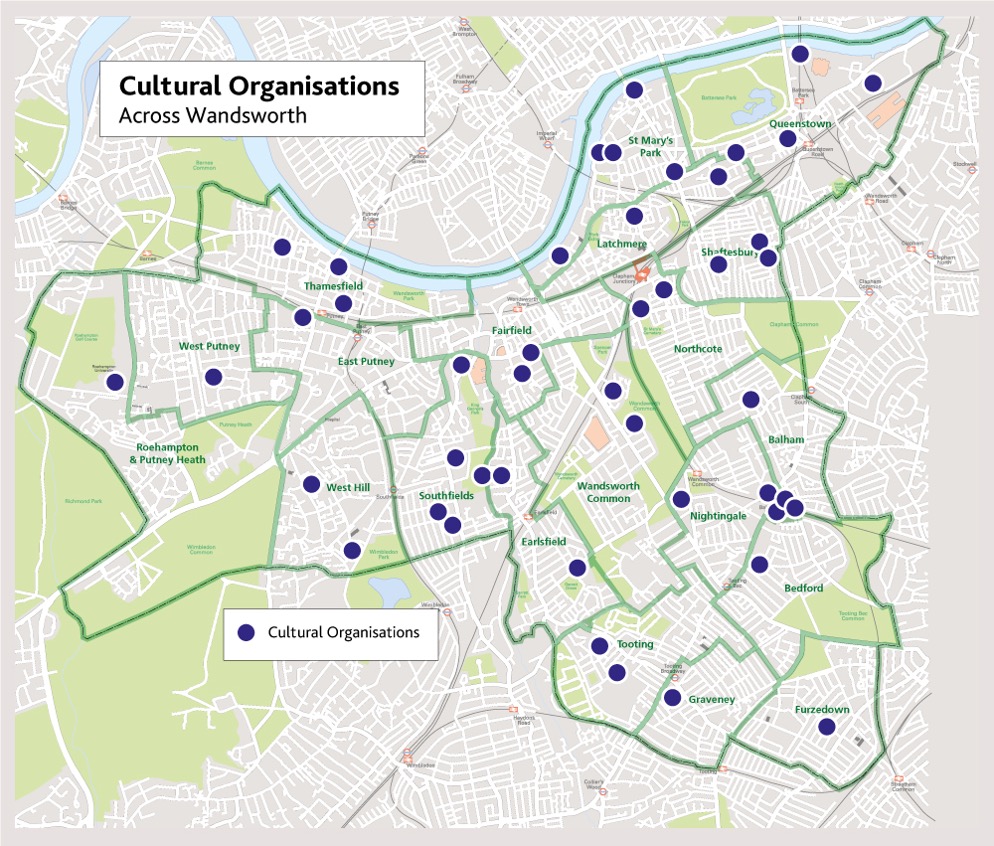
There are 65 cultural organisations and at least 2860 creative organisations based in Wandsworth (as shown on the map below). Key organisations based in the Borough include Battersea Arts Centre, Matt’s Gallery, National Opera Studio, Oily Cart, Putney Arts Theatre, Putney School of Art and Design, Royal Academy of Dance, Royal College of Art, Sprout Art, Tara Arts Theatre, Tavaziva Dance, Theatre 503, Turbine Theatre, Wandsworth Music, and World Heart Beat Music Academy.
Landmarks: There are many landmarks in the Borough which can be enjoyed, including Battersea Power Station, London Heliport, Young’s Brewery and the Peace Pagoda. Battersea Park is also a venue for many events including the Battersea Park Dog Show, Live at the Bandstand, and the London Motor Show.
Libraries: There are 11 libraries in the Borough offering local residents various local services, with further electronic library services (e-books and audiobooks) available across the Borough.
Places of Worship: There are 88 places of worship in Wandsworth. Beyond their religious role, many act as gathering places for community events. This may be as underestimate as other places of informal gatherings may not be listed. The detailed breakdown by group can be found on the Councils website 34.
Vibrant Town Centres: Vibrant town centres offer easy access to services, foster social interactions and support the local economy. Having easy to reach and diverse services encourages residents to walk, run errands and meet-up with friends and family. These offer an alternative to cars, increasing physical activity and helping to keep the air clean. These centres include Balham, Clapham Junction, Putney, Tooting, Wandsworth.
Sports and Leisure Venues: There are 8 sports centres, 4 leisure centres, 5 swimming polls including the Tooting Bec Lido, 16 sports pitches and 10 areas with tennis courts.
Wandsworth Council is working with the Arts Council England to pilot the Joint Cultural Needs Assessment framework which will sit on DataWand, cross referencing cultural provision and gaps in provision against other social and economic needs. This data will be available on DataWand by the Autumn of 2021.
4.1 Wandsworth Arts and Culture Health and Wellbeing Case Studies
In 2021 Wandsworth Council published a ten year Arts and Culture Strategy, including a range of case studies. It builds upon the strong foundations that have been laid by the Council, Cultural Organisations, residents and community groups create a myriad of vibrant creative offers. As programmes develop and are delivered more local case studies will be added to https://www.wandsworth.gov.uk/leisure-and-culture/arts/arts-and-culture-strategy/.
Case Study: Wandsworth Music Community Choir
Wandsworth Community Choir (WCC) was formed in April 2018 after demand from the many parents and carers, teachers, and Head teachers who had engaged with Wandsworth Music singing projects in schools. The choir was established by Wandsworth Music in partnership with Lifelong Learning as a community choir open to all people who live or work in Wandsworth. There are no auditions, no fees, and no previous experience is required. Members come from all walks of life and with varying degrees of singing experience, some have sung in choirs all their lives whilst for others it is their first experience of being part of a choir.
The choir is run by a dynamic team from Wandsworth Music who facilitate a fun, safe and friendly environment in which to learn some great songs, take part in performances, and enjoy the many positive mental health, social and wellbeing benefits of singing with others.
Since its formation, WCC has taken part in a variety of events such as the Tooting Food Festival, the Furzedown Festival, and Wandsworth Music Academy Summer Fair. WCC has also taken part in Borough-wide events, such as the Lifelong Learning Annual Awards Ceremony, Winter Sounds at Fairfield Halls, and Brighter Sounds at the Royal Festival Hall.
Over the last two-and-a-half years the choir has steadily grown in numbers, there have been 90 members on the choir register. The choir offers a space for connection, collaboration, a sense of wellbeing, and a real feel-good factor. This is evident in the feedback from members who openly share the impact that coming together and meeting once a week for a good sing has improved their mental health, wellbeing, self-confidence, and self-esteem.
Whilst the Covid-19 pandemic sadly meant an end of face-to-face rehearsals in March 2020, the choir has continued to meet weekly online. Although all the benefits of coming together as a singing community can never be entirely replicated online, the joy of meeting, seeing each other’s faces and sharing a joint love of singing was felt every week.
WCC has continued to meet online throughout lockdown They have recently produced their own lockdown video and participated in the virtual Wandsworth Music Winter Sounds concert in December 2020, performing alongside singers from the National Opera Studio, Wandsworth Music Academy, and Wandsworth schools.
Case Study: Reimagining Theatre for Young Audiences
Oily Cart challenges the accepted definitions of theatre and audience by creating innovative and highly interactive sensory theatre productions for disabled children, and young people who experience multiple barriers to access.
Each year, Oily Cart, based in Wandsworth, tours two original productions to over 5,000 children, young people, their families and carers across the UK. Working with the specialist schools in the Borough and local families, Oily Cart tailor their performances to individual children and young people with a focus on access and engagement. They also produce accessible family shows that provide opportunities for the integration of both disabled and non-disabled audiences.
For almost forty years Oily Cart have played a key role in supporting young people, demonstrating their absolute commitment to:
- making a positive difference to the lives of disabled children, young people and their families
- encouraging participation and enjoyment in cultural activity for disabled children and young people who face complex barriers to engagement
- providing shared social experiences where families can participate together
- responding to significant demand from specialist school and family audiences where there is a serious gap in cultural provision for these audiences
- raising the public and cultural profile of these audiences and the importance of cultural provision for them
- placing the disabled child or young person as the reason for and the central focus of the work.
“Every child’s need was met. We saw reactions in some children that we hadn’t experienced before. Very emotional and very moving!” Audience feedback from Oily Cart’s ‘Splish Splash’ show.
“I have taken my daughter to five different Oily Cart shows and each time I am reduced to tears. Tears of relief that a group of talented artists actually want to work with children like mine and are attuned to awakening interest and enjoyment in a wide variety of needs. In an Oily Cart show, everyone is equal. You cannot put a price on the feeling of acceptance and pride in seeing your child take part in a performance with people they haven’t met before; these are valuable skills being taught beyond just the experience of the show.” Audience Member.
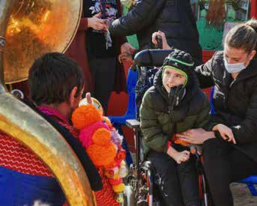 Over the pandemic Oily
Cart have taken their Doorstep Jamboree on tour across London to
families with children needing to shield. Image credit: Suzi Corker.
Over the pandemic Oily
Cart have taken their Doorstep Jamboree on tour across London to
families with children needing to shield. Image credit: Suzi Corker.
 Splish Slash, an Oily
Cart and National Theatre Wales coproduction. Image credit: Suzi Corker.
Splish Slash, an Oily
Cart and National Theatre Wales coproduction. Image credit: Suzi Corker.
Case Study: Supporting People with Neurodivergent Needs
CoDa Dance Company is a unique contemporary dance company specialising in thought-provoking outdoor and site-specific performances, participatory community work, and utilising dance as a physiotherapy tool for neurodisabled people. CoDa has been creating work for, by, and with the local community in Wandsworth since 2013, with a specific focus on Roehampton and Putney wards.
In 2018, using funding from the Wandsworth Grant Fund, CoDa established a pilot programme at the Royal Hospital for Neurodisability (RHN) in Wandsworth. The workshops were designed to give patients, family members and carers a space to increase their physical activity, improve mood and wellbeing, and increase social interaction within the hospital. The sessions were also designed to help family members and carers gain insights into the lives of people living with neurological conditions. Three years on, the pilot programme has turned into an established programme, funded by the hospital, and delivered regularly in a number of wards, and in two of the residential wards to 100+ patients a year.
Most recently, and partly in response to Covid 19, CoDa is creating work that will be able to be viewed through digital technology. They will continue to develop work that sheds light on the unique and unusual symptoms experienced by people living with neurodisabilities. CoDa works closely with creative consultants who are people living with neurodisabilities to enhance audience experiences, the stories we tell, and how they are told.
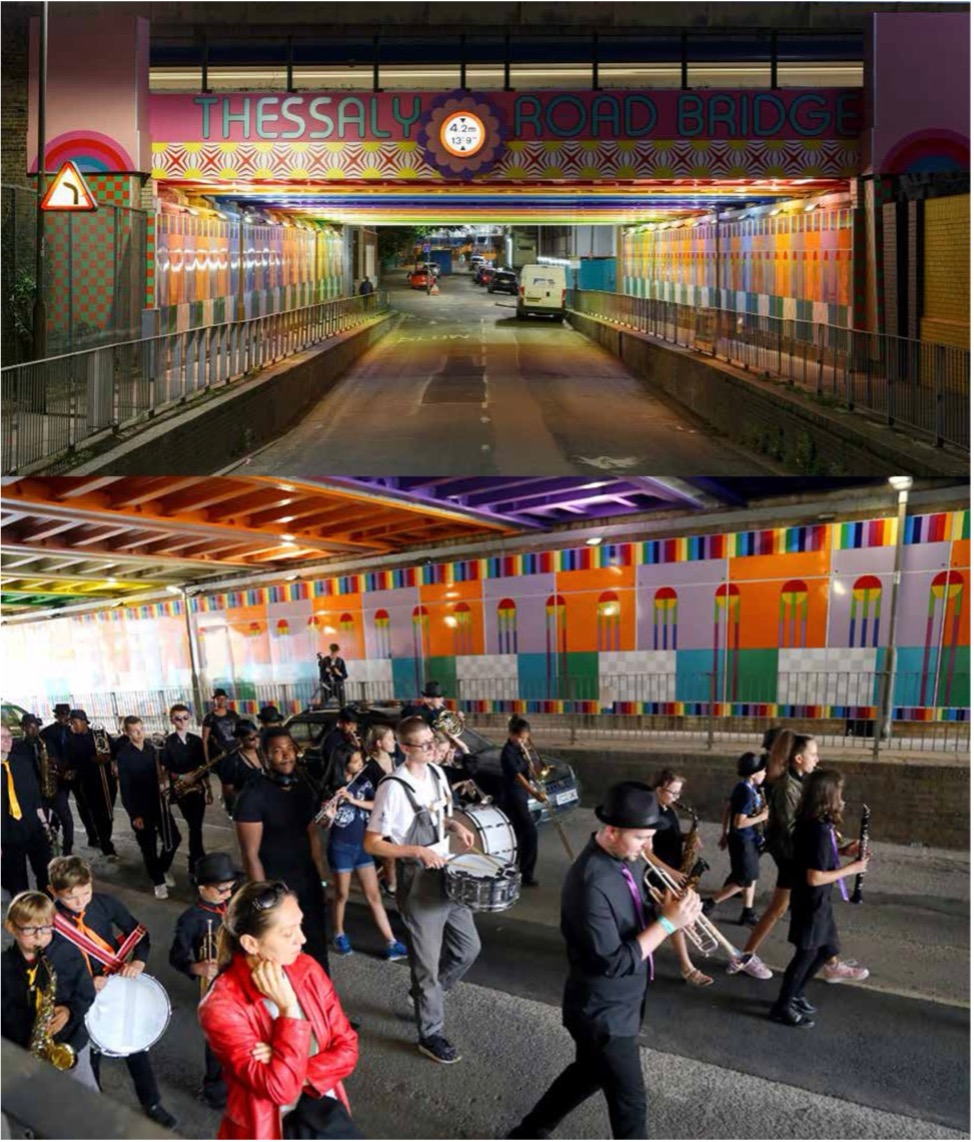
Case Study: Happy Streets
Happy Streets was an outdoor arts festival, focused on community cohesion and wellbeing, that took place for the first time in July 2019. The first festival celebrated the completion of Yinka Ilori’s colourful redesign of a railway underpass on Thessaly Road, a key north-south route in Nine Elms that links the Savona, Patmore and Carey Gardens estates.
The transformation of what had been an unwelcoming pedestrian underpass was the starting point. Following a design competition, held in partnership with the London Festival of Architecture, Wandsworth Council commissioned Yinka Ilori’s ‘Happy Street’ design in November 2018 to brighten up the dark underpass, used daily by residents, schoolchildren and commuters.
From the outset, community engagement was at the heart of this project. Residents were invited to view a shortlist of six designs at the ROSE Community Clubroom and offer their comments and preference on whose design they wanted to see brought to life in person or online. Pupils from St. George’s School were then invited to meet with Yinka Ilori as he finalised his winning design.
In early 2019, the Council commissioned a new solo exhibition from Ilori, ‘Types of Happiness’. This was presented in a pop-up gallery space run in partnership with the Royal College of Art, thereby introducing more of the local community to his work and giving people a chance to get familiar with his proposed underpass design. A series of community engagement workshops were held, offering everything from hands-on architectural activities to colouring-in mural activities.
Work on the underpass was completed in July 2019, when a festival was held in the outdoor and public spaces either side of the bridge, spilling out into the surrounding streets, to celebrate its transformation. The Happy Streets festival took over four venues (the playground spaces of St George’s School, a ball court, and two community centres), encouraging people to move through the newly improved underpass throughout the day. The festival programme included 46 performances, participatory events and workshop opportunities, themed around happiness and wellbeing, including taster sessions of activities that were available locally for residents and could help improve neighbourliness and longer-term wellbeing, such as musical instrument learning, dancing or gardening. The content of the festival was developed hand-in-hand with local artists and community groups, bringing together local choreographers, beat-boxers, church groups, puppeteers, gardening groups, café owners and musicians, alongside professional artists and arts organisations from further afield.
Happy Streets was entirely free to attend, with all events wheelchair accessible and BSL-interpreted. Brochures were hand-delivered in advance to every residential address in the local neighbourhoods, including existing estates and new developments; attendance totalled 1872 during the afternoon.
Happy Streets provided a crucible for residents, community groups and organisations of different kinds, to meet each other through their participation in the day. As two participants commented “It was fantastic! What a great way for the whole community to get together. We met some really interesting people on the day and found out about other things happening in the area, i.e., with St George’s school and church,” and “It makes it feel as if it’s an area that is not forgotten but celebrated.”
Case Study: Breaking Down Barriers into Music for Young People from Diverse Backgrounds
World Heart Beat (WHB) was founded in 2009 in an old, converted warehouse in Southfields to address the lack of free and affordable music tuition available to South London’s most disadvantaged young people. They have become one of the UK’s leading music hubs, continuing to support young people in Wandsworth. They are renowned for their inclusive global music programme, youth-led approach and the pathways they open up to conservatoires and music careers for diverse young talent. WHB also place a strong focus on how creating music supports young people’s mental health as well as their personal development.
From an intake of 70 students in 2010, they have grown to 370 students in 2019–2020. Each year they:
- inspire 2,000 young people to take up an instrument, often for the first time, through taster sessions delivered with more advanced students in schools and community settings in some of Wandsworth’s most deprived areas
- support 370 young people aged 5–25 to develop their musical and performance skills through 1:1 and group teaching and band ensembles. By offering a repertoire that includes Asian, Jazz, Gospel, Eastern European, Gypsy, Latin, Reggae and Tabla genres, they reflect the diversity of the Borough and its large Asian, African, and Caribbean population. They have established a diverse student body, with 70% identifying as ethnically diverse and over half receiving full bursaries and free instruments
- provide professional development to 30 exceptional young musicians aged 15–25 as part of the Music Leaders Students Programme. Music Leaders students receive mentoring from professionals, training in vocational music and production, and are given opportunities to perform, record and curate and produce concerts and events for the local community. The Music Leaders students also serve as role models for younger students, providing mentoring and training and co-delivering our taster workshops. 70% of WHB’s Music Leader students now study at top music conservatoires/universities, have secured professional roles in the music/ creative industries, or have been recruited to training programmes in other sectors, and twelve of WHB’s teachers are past alumni.
In Autumn 2021, WHB will be opening a second performance hub and education centre in Embassy Gardens as one of the Nine Elms cultural anchor tenants, in a space provided by Eco-World Ballymore on a 50-year peppercorn lease. The new Academy will serve as an important cultural anchor in a rapidly changing neighbourhood, addressing the lack of accessible grassroots music venues in South London, and delivering a programme of over 100 concerts and events each year. The new space will enable WHB to double the number of students they can work with and extend their focus to marginalised young people.
“Having something you can do, to be passionate about, a skill you can develop and really hone, makes such a difference. It helps you navigate through all the negative distractions and influences growing up and gives you belief and confidence that you can succeed. Without music, the saxophone, the friends that I had in music and the role models I found at World Heart Beat I would not be where I am today.” Kwabena, 23yrs
5. Healthy Communities
5.1 Utilisation of Outdoor Space for Exercise/Health Reasons
Utilisation of outdoor space for exercise or health reasons: In Mar 2015 - Feb 2016, Wandsworth’s rate was 19.8%, which was the 7th highest in London, 10.3% higher than the England average and 9.6% higher than the London average. The latest Borough figure for Mar 2015 - Feb 2016 was also 33.1% higher than in Mar 2011 - Feb 2012, in comparison with 27.8% increase in England’s rate in the equivalent time period.
Source: OHID: Public Health Profiles
Source: OHID: Public Health Profiles
5.2 Crime and Community Safety
Additional ward level crime data can be found on DataWand.
Wandsworth is the safest Inner London Borough. There have been four consecutive years of crime increase in London, and this is also the case in Wandsworth. This increase has been driven by rises in violence and property crime. Wandsworth’s crime increases last year (+3.7%) were slightly higher than London (1.2%). Local offence rates in the Borough (81 per 1000 residents) is lower than Inner London (119) and London (94).
There have been increases across most crime types. Over 12 months, the highest increases were seen in robbery, burglary and violent crime. Theft offences (including vehicle crime) continue to account for the highest proportion of total offences, but violent crime now accounts for almost 1 in 3 offences, an increase from 1 in 4, four years earlier.
Violence
More than 30% of crimes in the Borough in the last 12 months were classified as ‘Violence against the Person’ of which 30% involved injury. The 10% increase in violence against the person over the past year is greater than the increase in London or Inner London and is likely to have been influenced by the overall rises in crime. Despite this, Wandsworth’s rate of 7.56 offences per 1,000 residents remains lower than the rates of London (8.64) and Inner London (10.11).
Knife Crime
Knife Crime is a continuing concern across London and England due to increasing levels of offending in what is one of the most serious, potentially fatal crime types. Wandsworth has not been immune to this trend as the Borough is located near to Westminster, Southwark and Lambeth, which in terms of volume are among the worst 5 affected in London. Knife crime offences are not limited to stabbings, with the majority relating to offences where knives were intimated or used as a threat.
Last year, Wandsworth saw a 17% increase in knife crime, much higher than Inner London (2.3%) and London (1.2%) increases. However, the rate of knife crime (1.36 offences per 1,000) remains below the London average (1.65) and the lowest in Inner London for the 4th consecutive year. A third of described suspects were BME and aged 10–25 years.
Burglary
Burglaries have increased in Wandsworth. The number went up from 2,286 in 2015/16 to 2,324 in 2016/17 (2% increase) and 2,687 in 2017/18 (16% increase). The Wandsworth rate of burglary is lower than Inner London.
Personal Robbery
Personal property robbery has been increasing for the past three years. In 2017/18 there were 729 personal robbery cases, an increase of 18% compared to 2016/17. However, the Borough still has lower rate than Inner London and remains ranked in Quartile 1.
Reoffending
A minority of individuals are responsible for a disproportionate number of offences. Ministry of Justice data shows that the re-offending rate for adult offenders in Wandsworth was 26%, slightly lower than last year (29%).
Substance dependence and misuse contribute to offending and reoffending. For those individuals drug tested by police upon arrest, 57% (n=223) tested positive. This rose to 61% for those individuals tested because their offence type was more likely to be linked to drug or substance abuse. Ambulance services continue to respond to large numbers of events in Wandsworth where drugs (n= 578) and alcohol (n=2,208) are a factor in injuries, violence or intoxication. From April 2017 to March 2017, 16% (n=20) of adults with a substance misuse treatment need were engaged in community-based structured treatment following release from prison, lower than London (21.9%) and England (32.1%).
Violence Against Women and Girls
The increasing trend in domestic abuse has continued with an 8.1% rise over 12 months. The long-term increase is higher than experienced in London. This is believed to be heavily influenced by a change in police and victim reporting practices.
The Multi Agency Risk Assessment Conference (MARAC) meets monthly to discuss and manage the highest risk cases of domestic violence in the Borough. There were 328 cases over the past 12 months, a 24% rise on the previous 12-month period. 50% of cases involved were a BAME victim. While the largest increases were in the under 25 (n=49) and over 65(n=24), the most common age group remained 25–34 (n=108). Mental health and substance misuse were a common theme among victims and suspects.
Increases in sexual offending reporting are believed to be linked to the changes in recording and reporting practices. Overall, the rate of reported offending remains the lowest in Inner London. 34% of incidents are classified as rape. Non-historic offences showing a reduction in victims under 18, 62% reported as occurring between known parties. The remaining 66% of incidents are classified as other sexual offences.
Keeping Children and Young People Safe
Over the last 12 months, there has been a slight increase in the number of young victims of crime (n=1,109) but a reduction in the number of young suspects (n=1,569) and young people accused of a crime (n=250). Nevertheless, young people, particularly those aged 10–17, remain disproportionally affected by crime in Wandsworth. For young victims, this is most evident within the crime types of violence, sexual offences and robbery. There continues to be an overrepresentation of BAME young people suspected or accused of crime. During 2017/18 there were 72 first time entrants to the Youth Justice System, a 5% decline compared to the previous year. There has been a steady decline over the last 10 years. The rate per 100,000 10–17-year-olds is 332 and though this is an improvement and lower than the London average (353), it has regressed to the 4th lowest In Inner London having previously been the 2nd lowest.
Hate Crime
Rates of hate crime in Wandsworth are lower than those throughout Inner and Greater London. The majority (almost 4 in 5) of hate crimes in the Borough over the last 12 months (n=489) were racist in nature. These crimes saw a decrease of 3% compared to the year before. Considering only racist and religious hate crimes, the Borough’s rate was 151 per 100,000 residents, lower than Inner London (237) and London (183). Locally, and regionally, there was an increase in reports of homophobic hate crime which increased to 73 from 62 the year before.
There is an over representation of BAME victims of hate crime. Incident hotspots are frequently in and around public places such as town centres. The majority of hate crimes involving offensive language as an aggravating level of assault remains low.
Crime and Anti-Social Behaviour (ASB)
Tackling crime and anti-social behaviour requires a problem-solving approach and the joint working of agencies across different sectors. The Crime and Disorder Act 1998 requires the Local Authority to form a statutory partnership which is known as the Wandsworth Community Safety and Youth Offending Partnership Board. The Board has developed a strategy to deal with the prevention of crime, reducing reoffending and serious violence, substance misuse, and anti-social behaviour. This will be refreshed for the following 3 years in line with the next Mayor’s Policing and Crime Plan.
Wandsworth Council produces an annual Community Safety Strategic Needs Assessment, a statutory annual analysis of crime and disorder to inform the Community Safety Partnership Plan. The following priorities were taken from the 2019 needs assessment with data covering a 5-year period Jan 2015 – Dec 2019:
- Motor Vehicle Crime
- Burglary
- Anti-Social Behaviour.
Crime and Anti-social Behaviour (ASB) have a direct impact on people’s health, well-being and lifestyle. Becoming a victim of crime can affect people differently. The recovery following a crime can be challenging especially if the criminal justice process is lengthy. If the person is already affected by an existing mental health need, then this could impact their recovery time and the impact of the crime could feel even worse.
Anti-social behaviour (ASB) affects many people and can have an impact on a person, their home and their community. People may think that an incident is small to start with, but anti-social behaviour can go on for a long time and become very serious. Not all anti-social behaviour is classed as crime but some of it can lead to crime.
The Annual Strategic Needs Assessment concluded that Wandsworth has the lowest crime rate in Inner London and although crime increased by 1.4% in 2019, it was still below London (+8.7%) and Inner London (+11.6%).
The figure below shows Wandsworth’s notifiable offences by Ward.
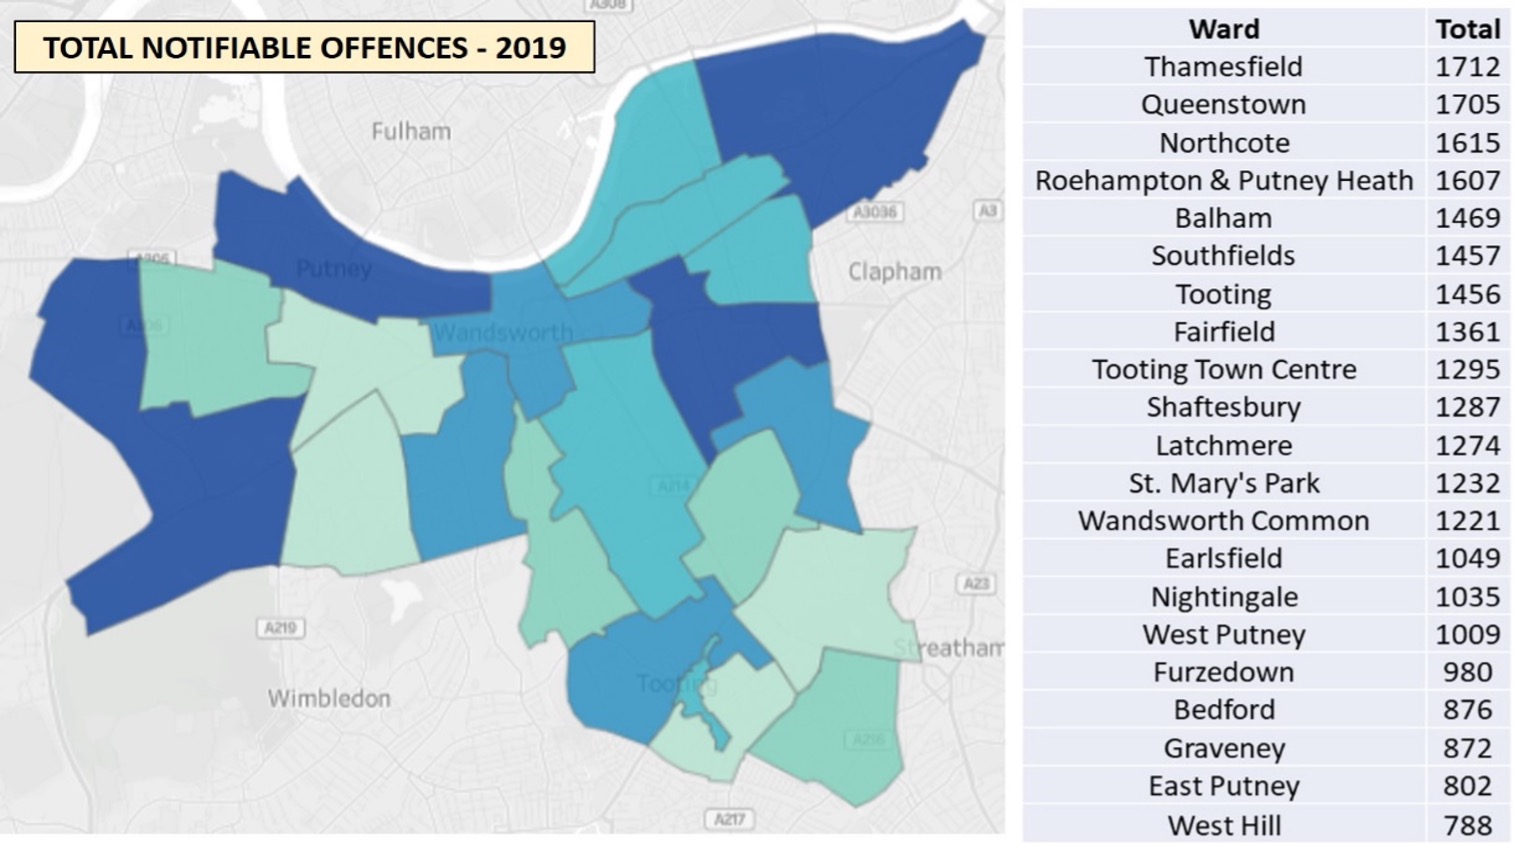
Source: Metropolitan Police Service, Crime Data Dashboard, December 2020
Reports of anti-social behaviour received by the police in Wandsworth increased by 12% in 2019, a total of 7,475. In comparison, London increased by 12%. The most affected wards remained Graveney, Latchmere and Tooting, (the figure below).
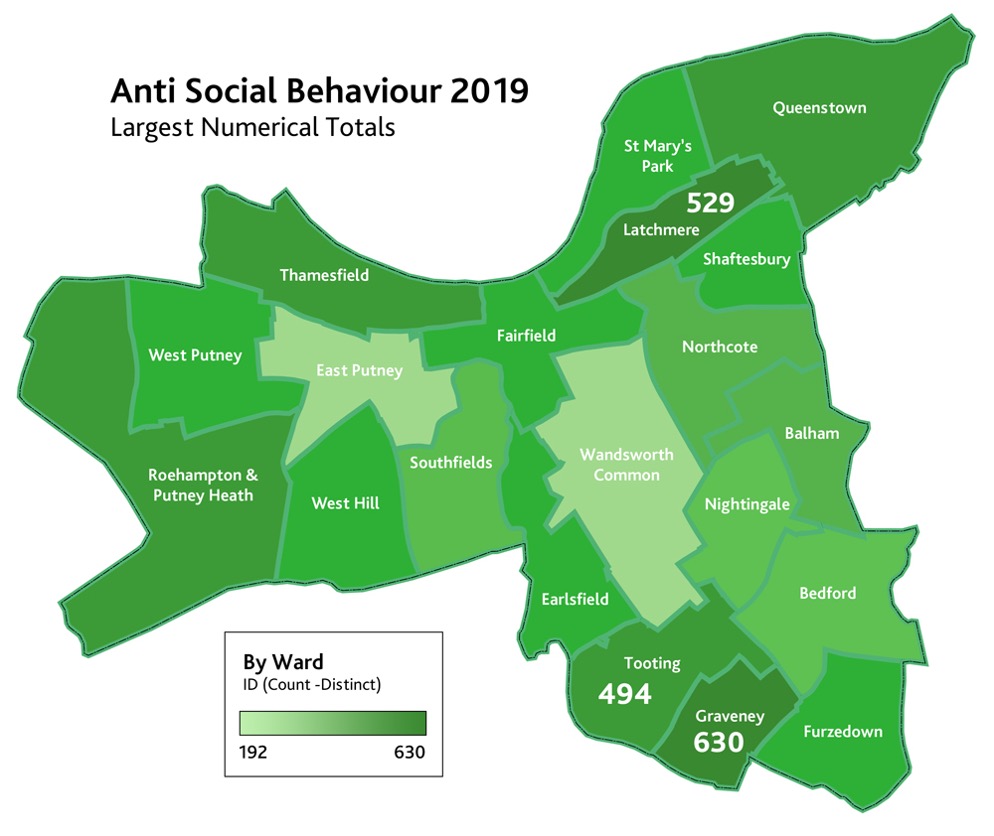
Source: Metropolitan Police Service, DARIS (Demand and Resource Information System) data extract, March 2020
Community Multi Agency Risk Assessment Conference
The Community Safety Service with the local police oversee the Community Multi Agency Risk Assessment Conference (CMARAC). This event considers high risk and complex residents who are at greatest risk of harm, in order to put together a multi- agency plan to provide support and intervention. Referrals can be received from professionals where an individual is causing harm to themselves or others in the community.
The agencies present also have the option for enforcement in using a Community Protection Notice Warning (CPNW), Community Protection Notice (CPN), Injunction, Possession Proceedings, Closure Notices, Closure Orders and Criminal Behaviour Order (CBO). Although they would first consider alternative options of support, enforcement action usually involves positive requirements for an individual to engage with substance misuse or mental health services.
The Community Trigger (also known as the ASB Case Review), gives victims of persistent anti-social behaviour (reported to the responsible agencies such as the council, police, housing provider) the right to request a multi-agency case review where the local threshold is met under the Anti-social Behaviour, Crime and Policing Act 2014.
Crimes Against the Elderly
In Wandsworth, there is a Crimes Against the Elderly Forum which meet every 6 weeks to look at crime trends and scams affecting the older community. They look at ways of ensuring older residents feel safe in their homes and outside. Unfortunately, Covid 19 prevented some of the planned such as the forum visiting sheltered accommodation clubrooms and day care centres. However, during Winter nights, Age UK in Wandsworth arranged for 1,000 care packs to be delivered to elderly residents by the London Fire Brigade. The packs were supplied by the Community Safety Service and included information on scams and how to avoid becoming a victim.
ECINS & Online Watch Link, OWL
The Community Safety Service has two digital products which help with our approach to tackling crime and disorder across the Borough. A new Online Watch Link (OWL) system which residents can sign up to and receive alert messages straight from their local police and council offices. A new CCTV Watch through this system has supported the police with their investigations.
The multi-agency case management system, E-CINS, allows agencies to share information on locations such as crime hot spots, and high-risk individuals. This will improve information sharing across sectors, and prevention of crime. The high-risk cases presented at a forum such as the Community MARAC often have complex needs such as dual diagnosis.
Offenders
Adult Offending & Re-offending
A minority of individuals are responsible for a disproportionate number of offences. The reduction of reoffending is of major importance for the safety of the local communities.
Ministry of Justice data shows that the re-offending rate for adult offenders in Wandsworth was 26%, lower than last year (29%). The proportion remains similar to London (27%) and England and Wales (28%).
In January 2019, the Community Rehabilitation Company (CRC) had 426 cases in Wandsworth, 19% lower than November 2017.
The latest data (January 2019) from the Ministry of Justice (MoJ) shows that 26% of adult offenders in Wandsworth went on to reoffend, a slightly lower proportion than both London and England, and a reduction compared to the previous year’s cohort (the table below). The rate of reoffences remained constant between cohorts. Concurrently, the London rate increased to match the Wandsworth rate and the England rate exceeded both.
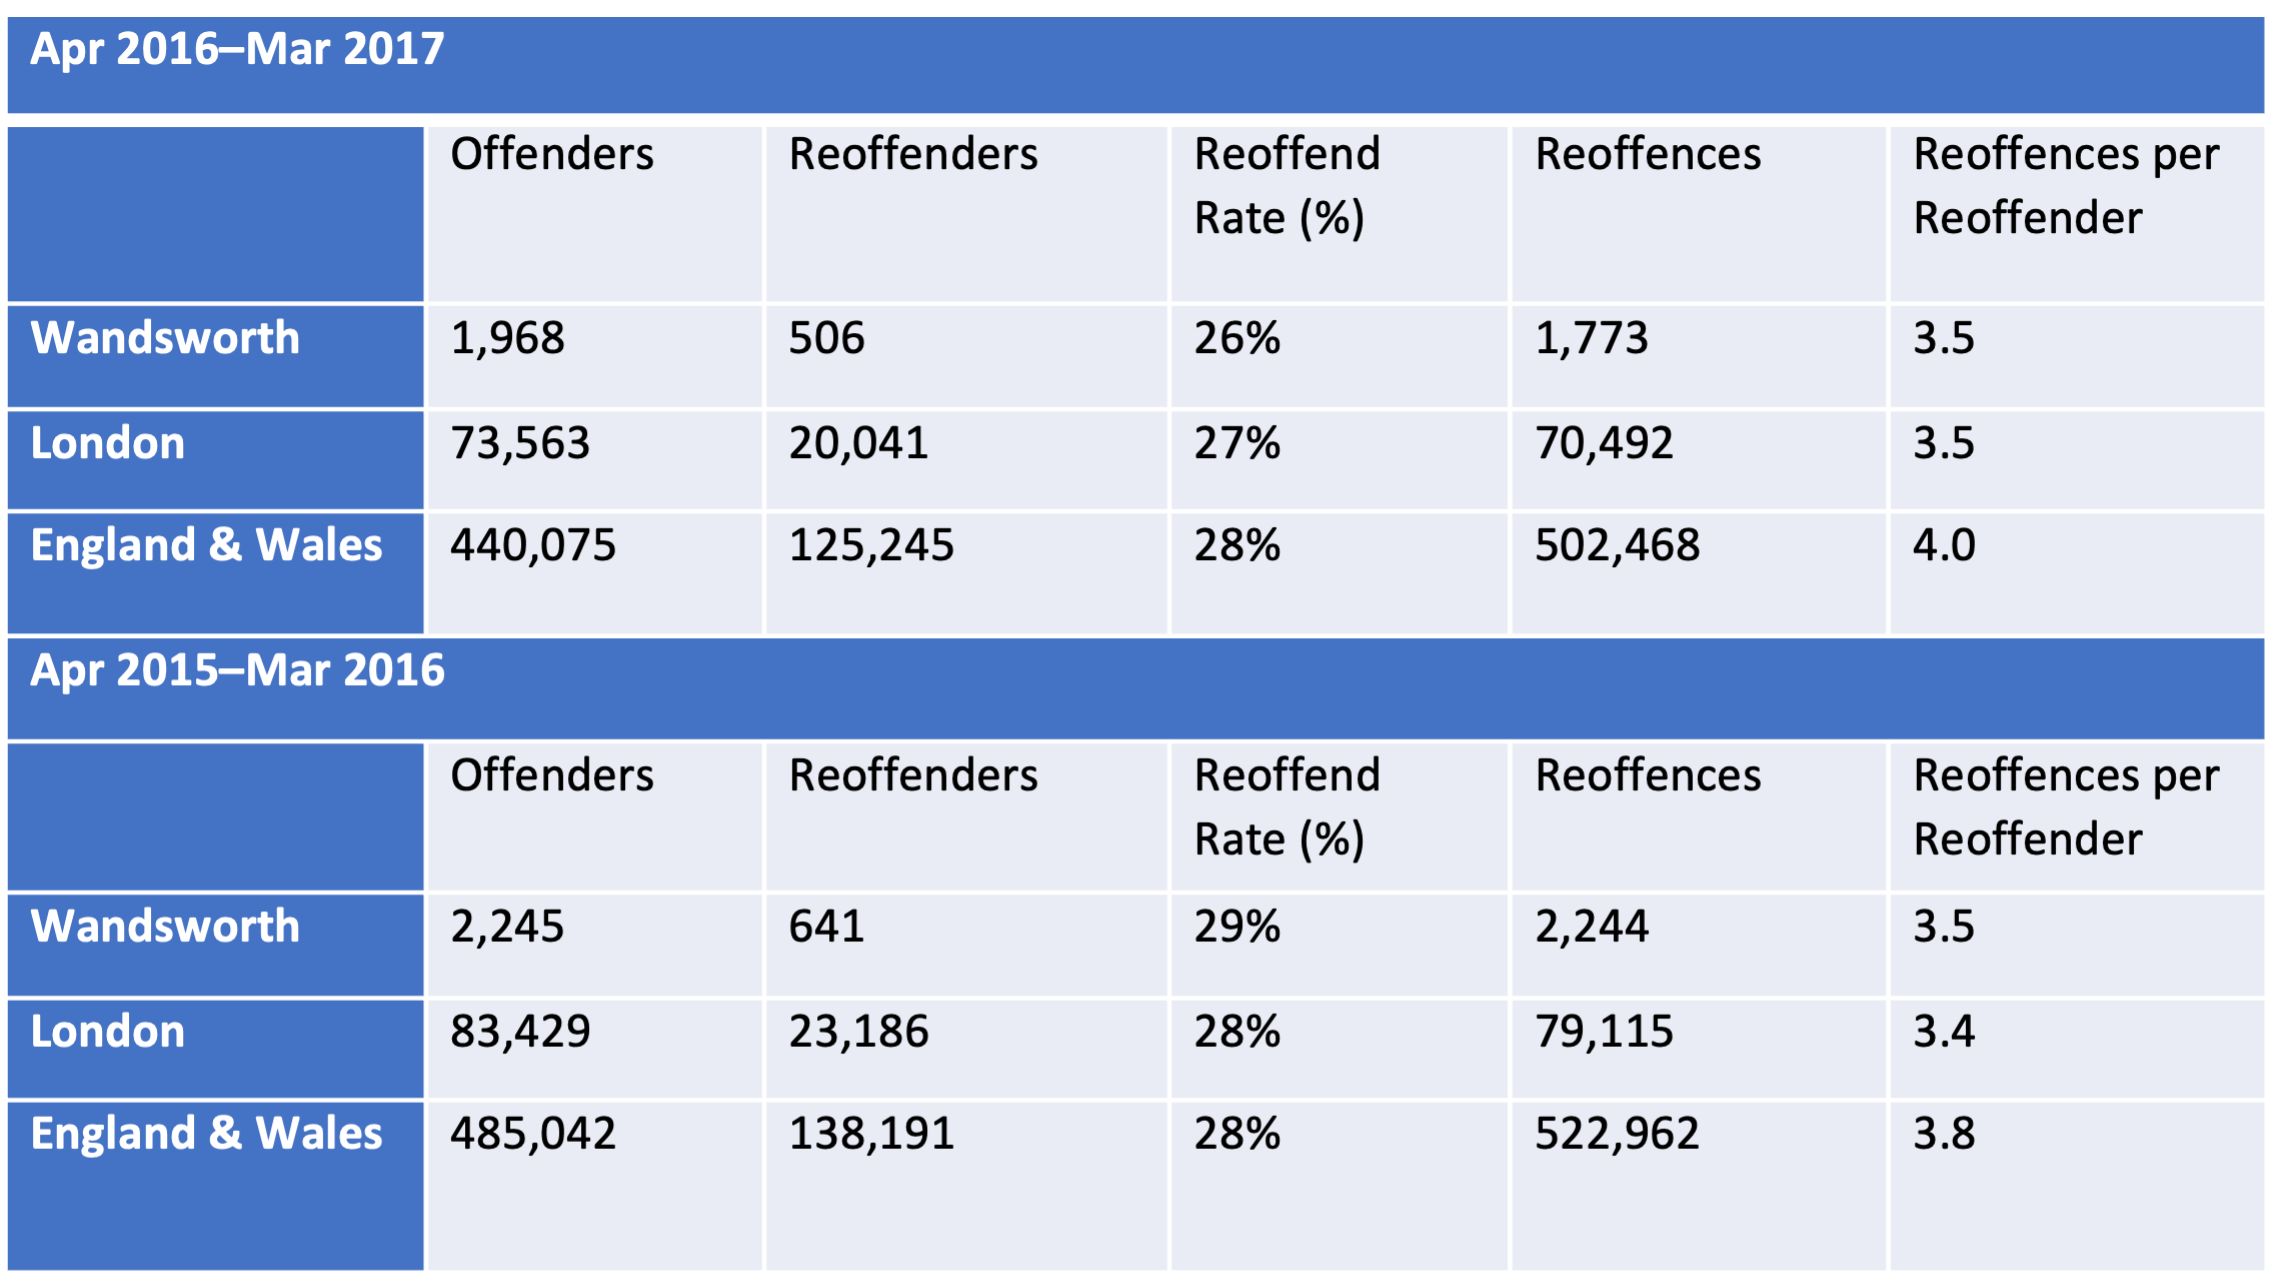
Source: MoJ, Proven Reoffending Statistics, 31/01/2019 (Limitation: In October 2015, there was a change in data source used by the MoJ that could affect comparisons).
Substance misuse and dependence contribute to offending and reoffending as well as exacerbating mental health problems and personality disorders.
For those individuals drug tested by police upon arrest, 57% (n=223) tested positive. This rose to 61% for those individuals tested because their offence type was more likely to be linked to drug or substance abuse.
Ambulance Services continue to respond to large numbers of events in Wandsworth where drugs (n= 578) and alcohol (n=2,208) are a factor in injuries, violence or intoxication.
Locally, from April 2017 to March 2018, 16% (n=20) following release from prison adults receiving substance misuse treatment were engaged in community-based structured treatment, lower than London (21.9%) and England (32.1).
Integrated Offender Management (IOM)
IOM is an evidence-based approach which provides a framework for partner organisations to manage and support violent offenders who are at highest risk of reoffending. The members of the IOM partnership are statutory agencies involved in offender management including the police, National Probation Service, Community Rehabilitation Company together with some departments of the Borough council, Community Safety Services, Housing Department, Social Services and a wider network of the Third Sector organisations including Battersea Art Centre and the Ace of Clubs. IOM aims to reduce reoffending and increase social inclusion by working with offenders to challenge their behaviour and address the underlying issues that may lead to reoffending. This is achieved by assessing individual need and supporting access and engagement with services across the seven pathways to prevent reoffending, as recommended by Mayor’s Office for Policing and Crime, (MOPAC):
- Attitudes, thinking and behaviour
- Accommodation
- Children and families
- Drugs and alcohol
- Education, training and employment
- Finance, benefit and debt
- Physical and mental health.
Additional issues that affect women who are part of the IOM scheme are domestic violence and sexual abuse.
The IOM programme continues to manage some of the most persistent and problematic local offenders in the Borough through a joint agency approach aimed at reducing offending and its impact.
During the financial year 2018/19 Wandsworth IOM cohort was comprised of 90 offenders. Performance is monitored by comparing the average number of arrests, convictions and prison days among the cohort before and after IOM intervention. The table below includes data which indicates nearly 60% reductions in arrests and convictions, alongside a 16% fall in days spent in prison. These are closely aligned to outcomes for each of the previous 3 financial years.
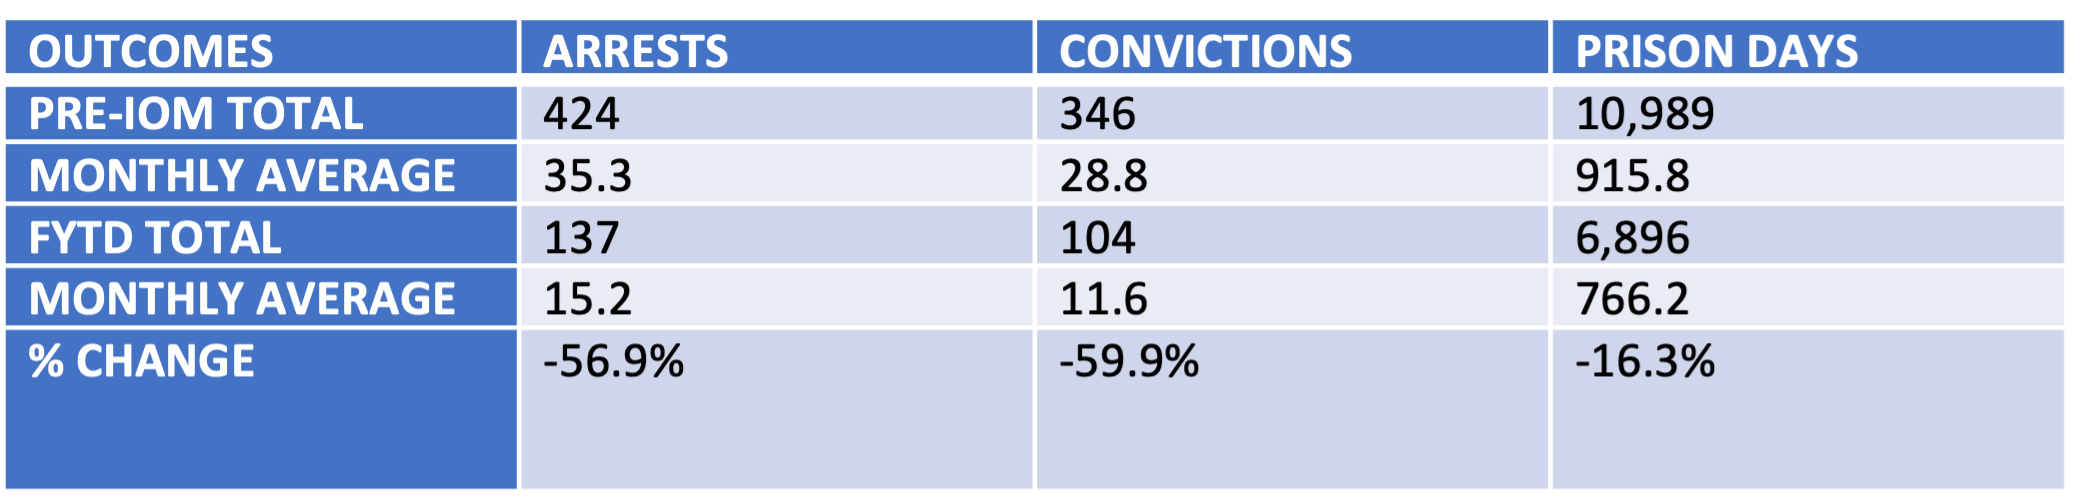
Source: MoJ, Proven Reoffending Statistics, 31/01/2019
The high-risk prolific offenders often have complex needs such as dual diagnosis, combination of drugs misuse and mental health problems, or personality disorders. It is still not clear what is the provision of coordinated services for this client group. There is also lack of behavioural change programmes for violent perpetrators which will reduce the impact of reoffending prevention. This requires increased joint working between all the IOM partners.
Serious Violence
In May 2021 the Wandsworth Community Safety Service commissioned the Violence Reduction Unit (VRU) to undertake a Needs Assessment on Serious Violence. The report will include qualitative and quantitative analysis of serious violence in the borough with input from as many stakeholders as possible. In addition, the assessment will also include an initial assessment of the current VRU funded projects in the borough for serious violence. The consultant will be further commissioned to work in Richmond and will conduct a deeper dive into identified areas of concern or best practice in Wandsworth so we can understand what factors are influencing the violence positively and negatively. In addition, the Council published the first report completed by the VRU funded Young Researchers Group in Wandsworth. Over 461 young people responded to the research led by their peers. This insightful report covers the topic of Knife Crime and will be shared with key partners and Boards in the borough. The next topic for 2021/22 will be Violence Against Women and Girls in public.
The Mayor’s Office for Policing and Crime (MOPAC) refers to serious violence as a public health issue that causes ill-health through fear, injury and loss, affecting individuals and whole communities. In order to tackle serious violence and the devastating impact it has on families, victims and communities in the Borough, Wandsworth Council Community Safety has successfully received Violence Reduction Unit funding to support multiple key projects to address the root causes of serious violence and to implement prevention activities.
Serious violence is defined by the South West Basic Command Unit (BCU) and the Community Safety Partnerships of each Borough as the crime types of violence with injury and knife crime, with some overlap between the two:
- Violence with injury is comprised of serious wounding (GBH) and assault with injury (ABH)
- Knife crime is comprised of knife violence and knife robbery.
The crossover between the two will feature within serious wounding or assault with injury.
Serious Violence Performance and Trend Data
This overview provides a brief analysis of Police Crime Data and London Ambulance Service Callout Data, both correct to December 2019.
Reported violence with injury fell by 4% during 2019. Whilst there has been a 2% rise over 5 years, Wandsworth maintains the lowest rate of violence with injury in Inner London (as shown in the tables and figures below). Although Wandsworth has the lowest rate of knife crime in Inner London, the total has increased by 63% since 2015 (+154). There have been 21 homicides over the past 3 years compared to 5 in the previous 2 years. Data trends also show that July has a regular spike of offences.
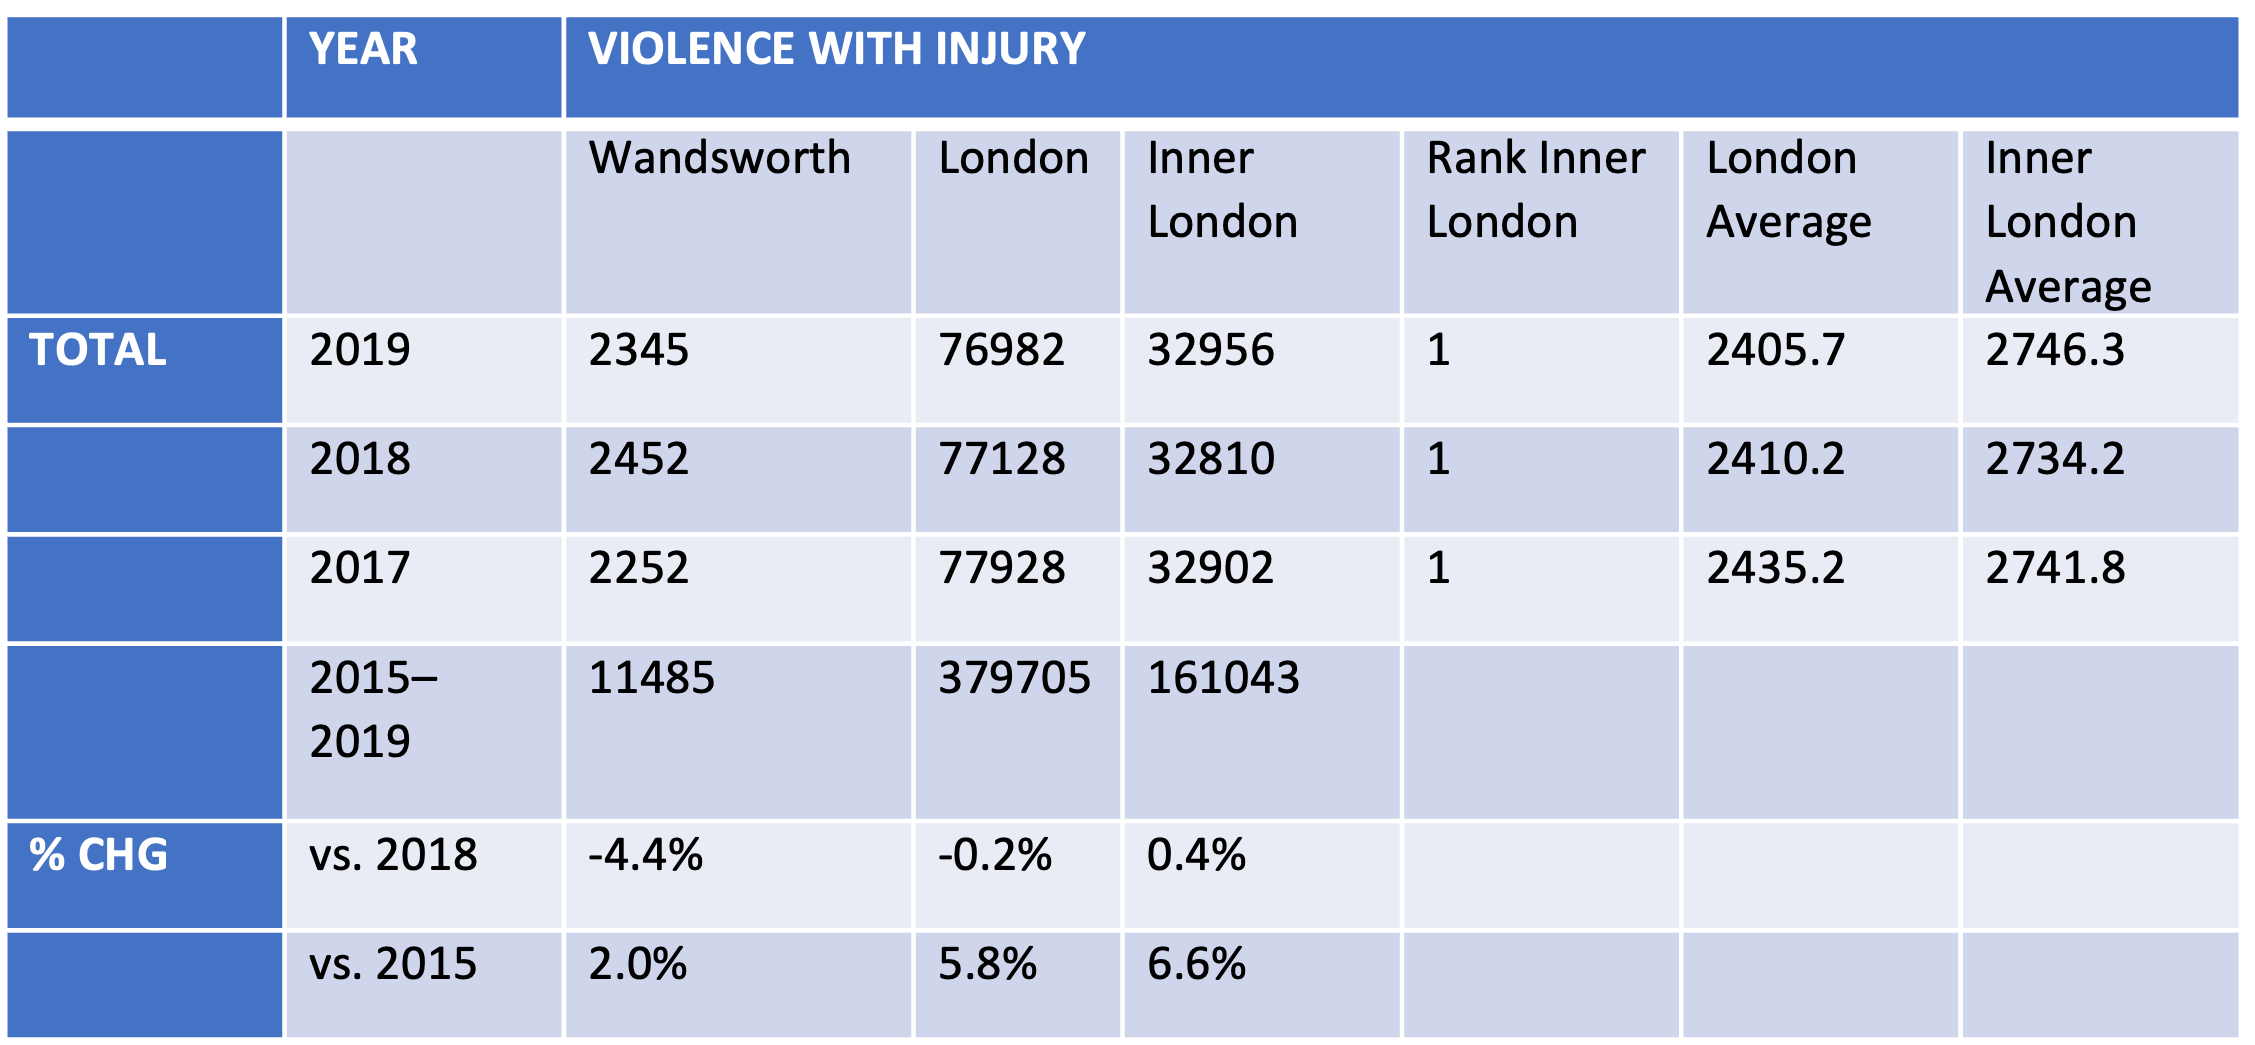
Source: Metropolitan Police Service, Crime Data Dashboard, February 2020 Note: Rank I. London shows Wandsworth rank compared to the 11 other Outer London Boroughs. 1 = lowest rank
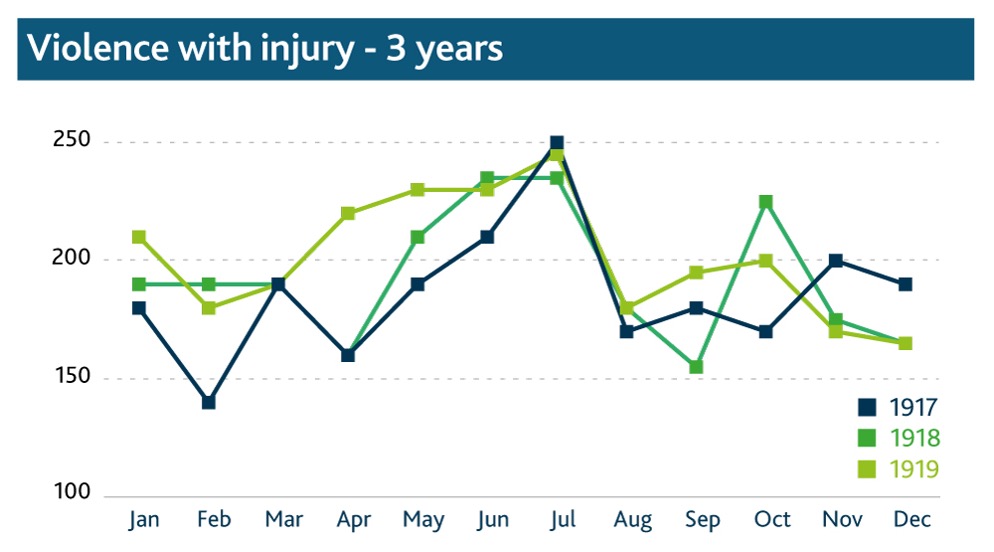
Source: Metropolitan Police Service, Crime Data Dashboard, February 2020
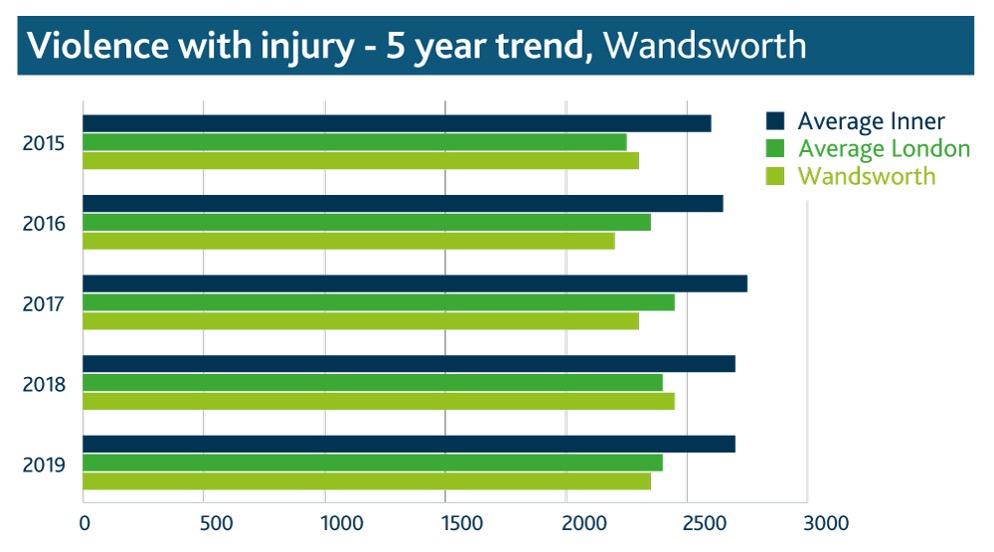
Source: Metropolitan Police Service, Crime Data Dashboard, February 2020
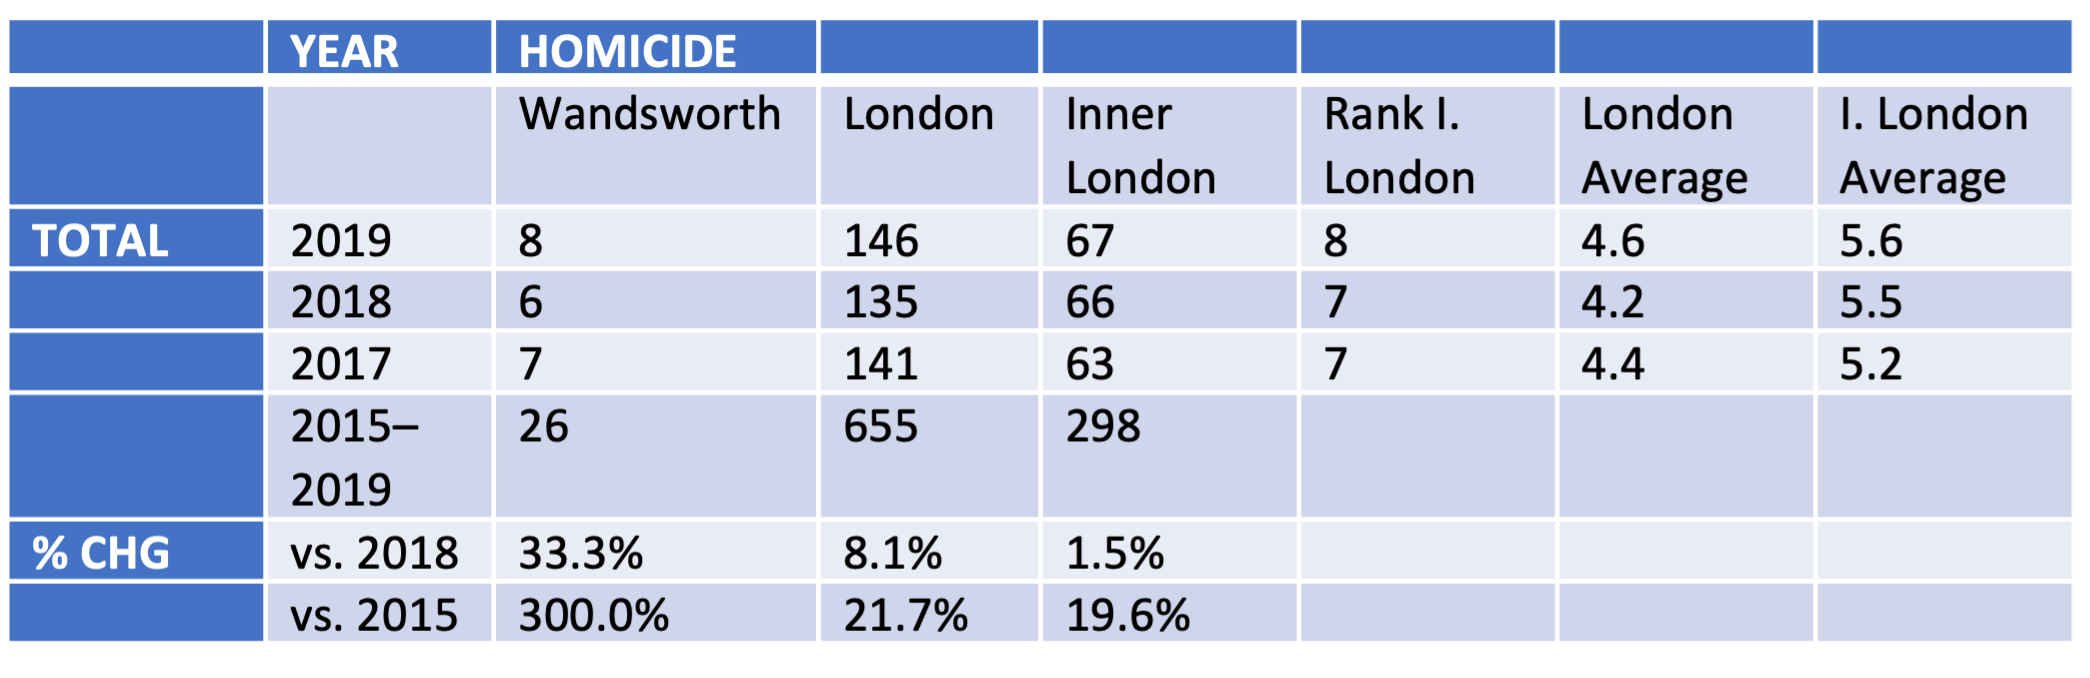
Source: Metropolitan Police Service, Crime Data Dashboard, February 2020 Note: Rank I. London shows Wandsworth rank compared to the 19 other Outer London Boroughs. 1 = lowest rank
The wards with the highest and lowest levels of violence with injury have been broadly consistent over the past 3 years, as shown in the table below.
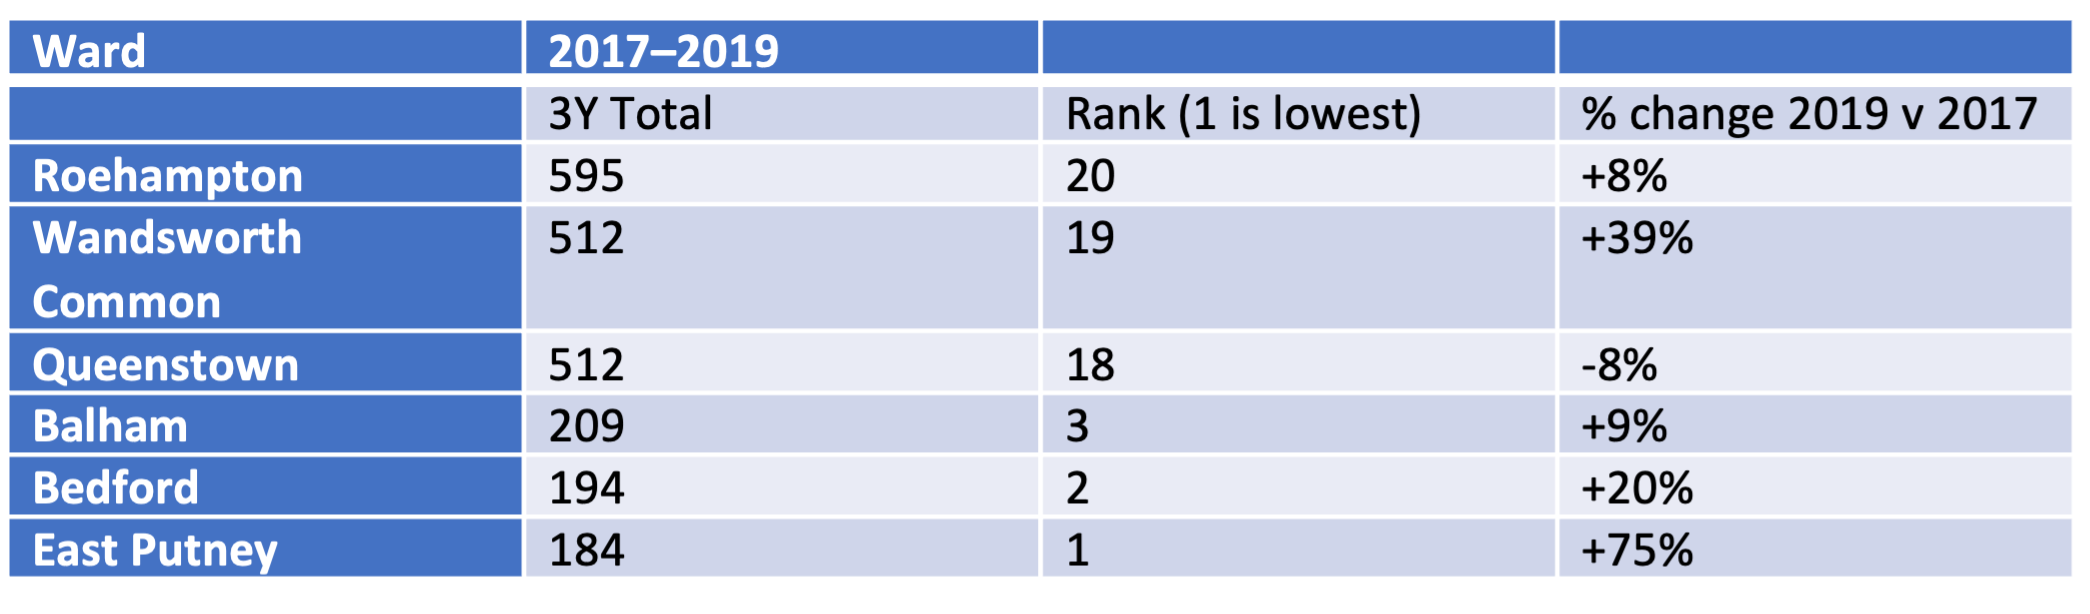
Source: Metropolitan Police Service, Crime Data Dashboard, February 2020
Over 3 years, knife crime classified as robbery has been most common in Latchmere, Northcote and Queenstown wards. Knife crime classified as violent was most common in Tooting, Latchmere and Queenstown. Over 3 years, ambulance callouts for assault were most common in Latchmere, Fairfield and Graveney.
Overview of serious violence crime reports (Police data extract).
Approximately 30% of violence with injury crime reports are domestic in nature. 57% of knife crime was classified as robbery and 42% as violence. This has gradually shifted over the past 5 years (2015 saw 38% robbery, 60% violence). Data shows that 94% of knife robbery involves the use of a knife as a threat or intimidation. 60% of knife violence involves the use of a knife in an attempt to injure. The breakdown of knife crime incidents is shown in the table below.
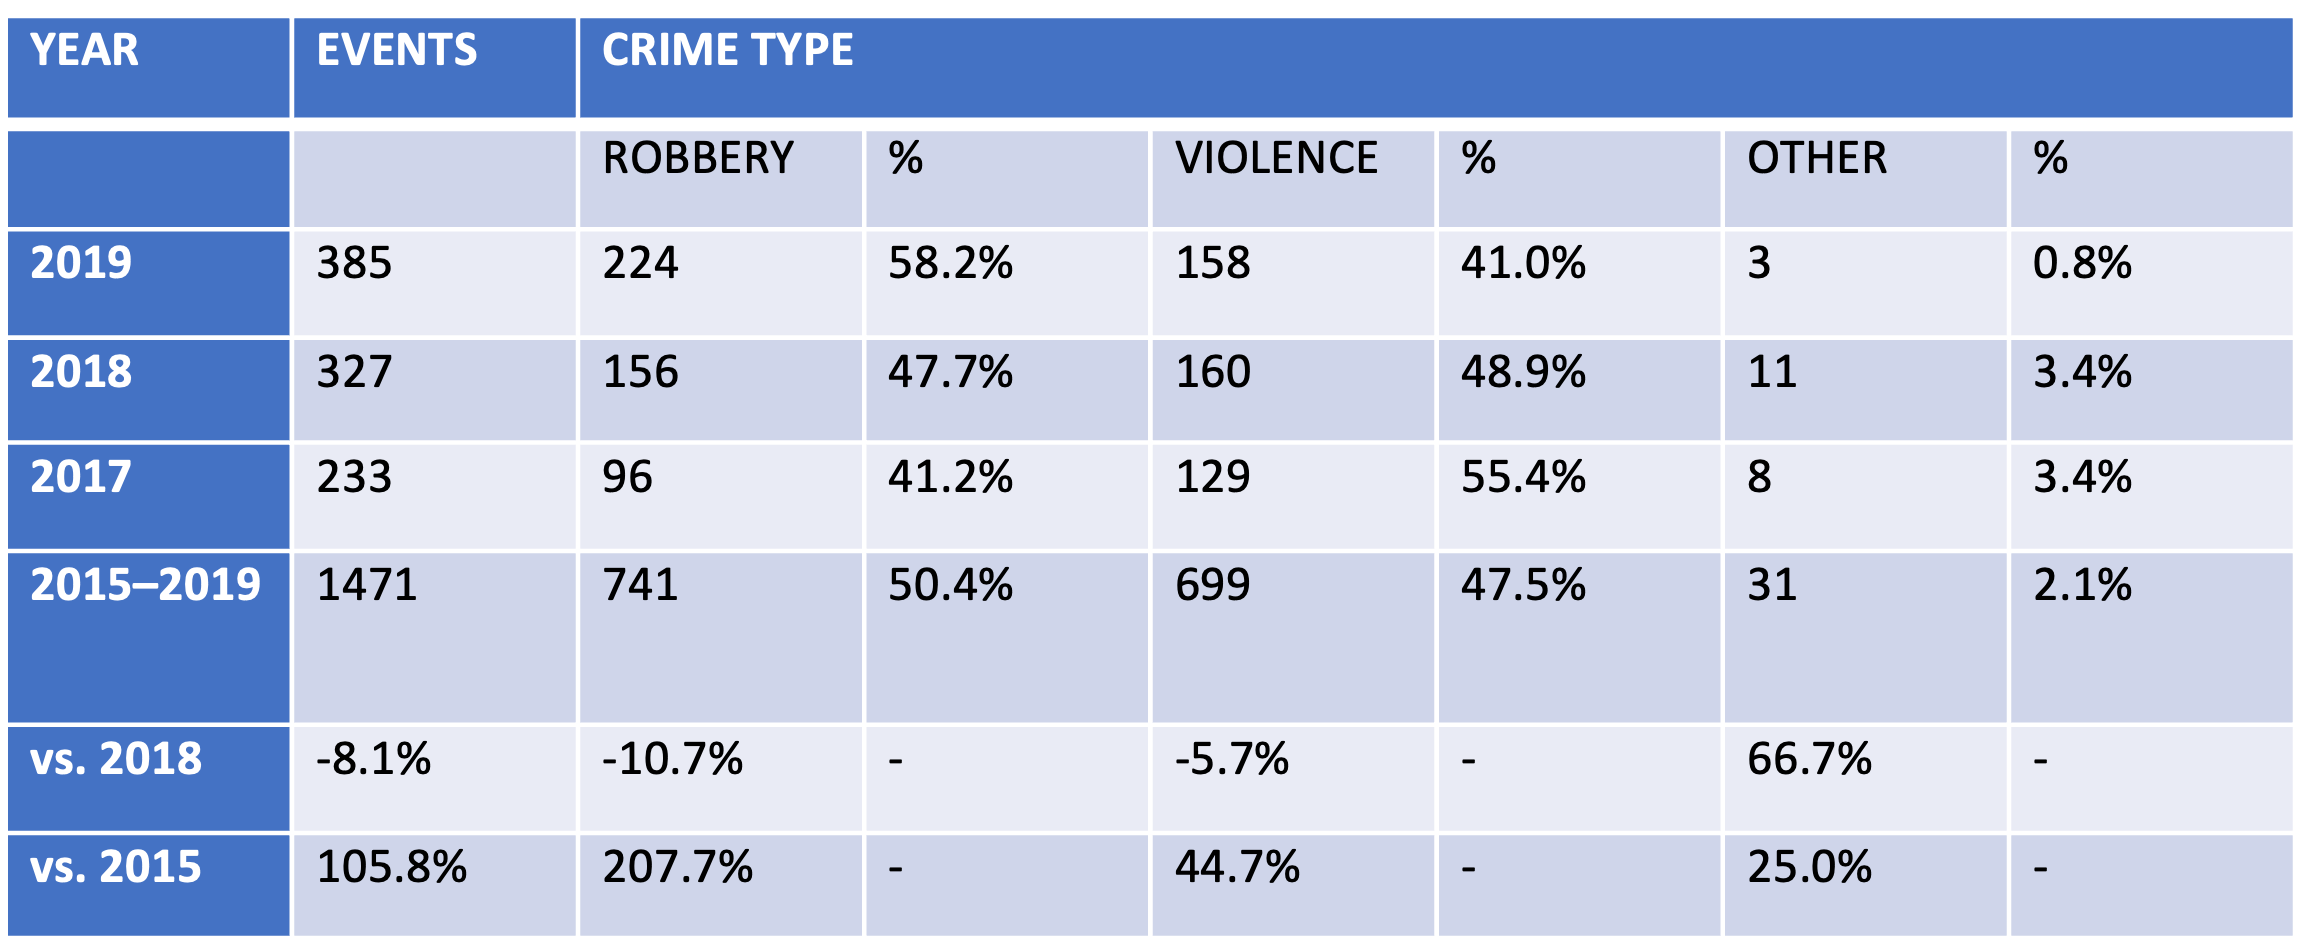
Source: Metropolitan Police Service, CRIS (Crime Recording Information System) data extract, March 2020
One or more suspects are known to one or more of the victims in approximately 55% of violence with injury crime reports. However, this proportion may be higher as approximately 20% of crimes have no recorded suspect.
Serious wounding offences are most common between 20:00 and 01:59, with Friday and Saturday experiencing higher levels of crime reports (the figures below).
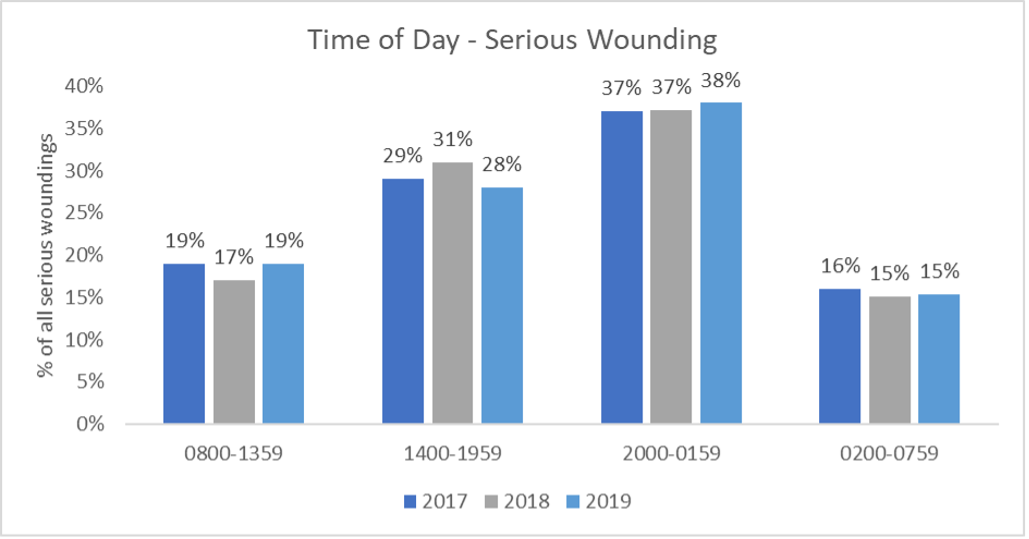
Source: Metropolitan Police Service, CRIS (Crime Recording Information System) data extract, March 2020
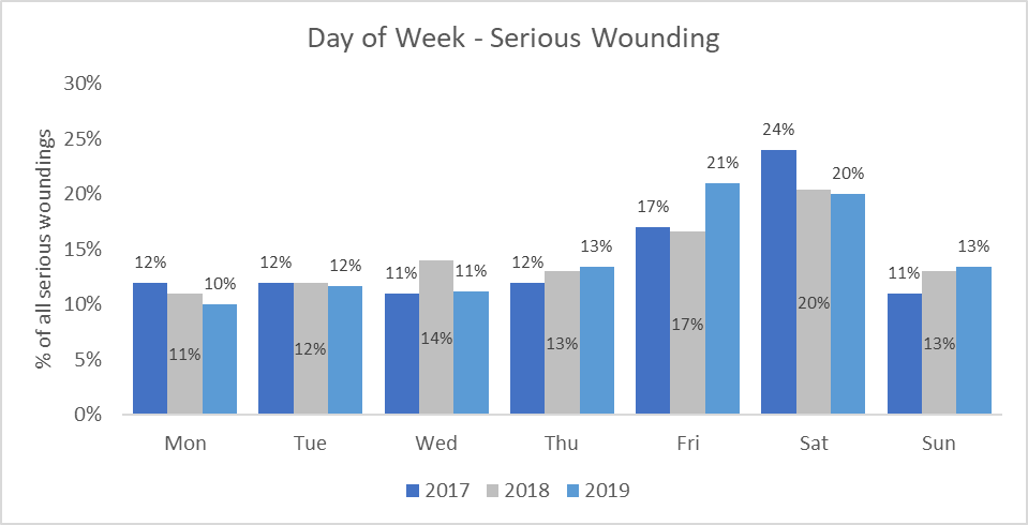
Source: Metropolitan Police Service, CRIS (Crime Recording Information System) data extract, March 2020
Assault with Injury offences are most common between 14:00 and 19:59. Friday and Saturday are among the most frequent days. (the figures below).
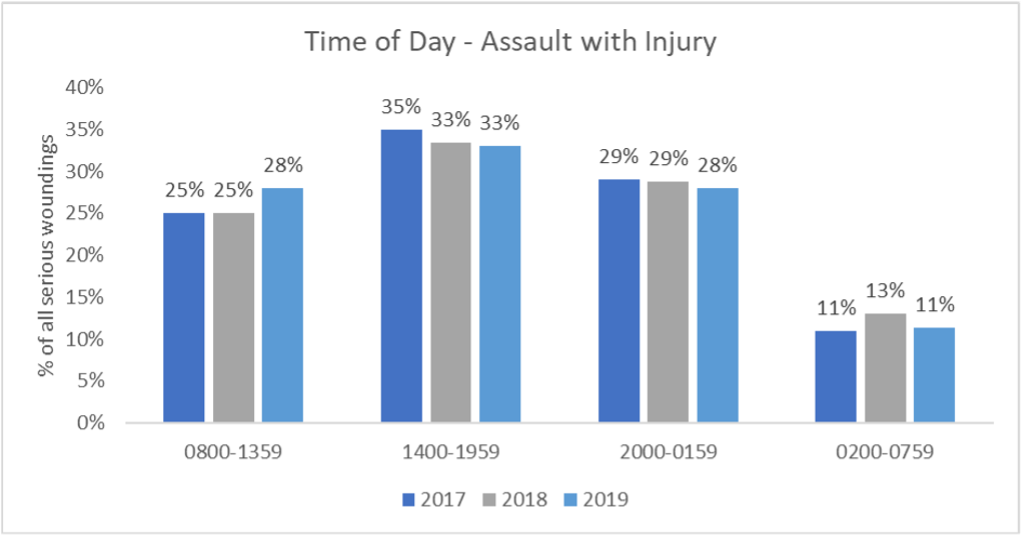
Source: Metropolitan Police Service, CRIS (Crime Recording Information System) data extract, March 2020
Yearly proportion of assault with Injury incidents by day of the week, Wandsworth, 2017–2019
Source: Metropolitan Police Service, CRIS (Crime Recording Information System) data extract, March 2020
Ambulance callouts for assault are most common between 20:00 and 01:59, on a Friday or Saturday. During 2019, there was a notable shift in time trends for knife crime. 50% of knife robbery has taken place between 14:00 and 19:59 and 40% of knife violence has taken place between 20:00 and 01:59 (the figures below).
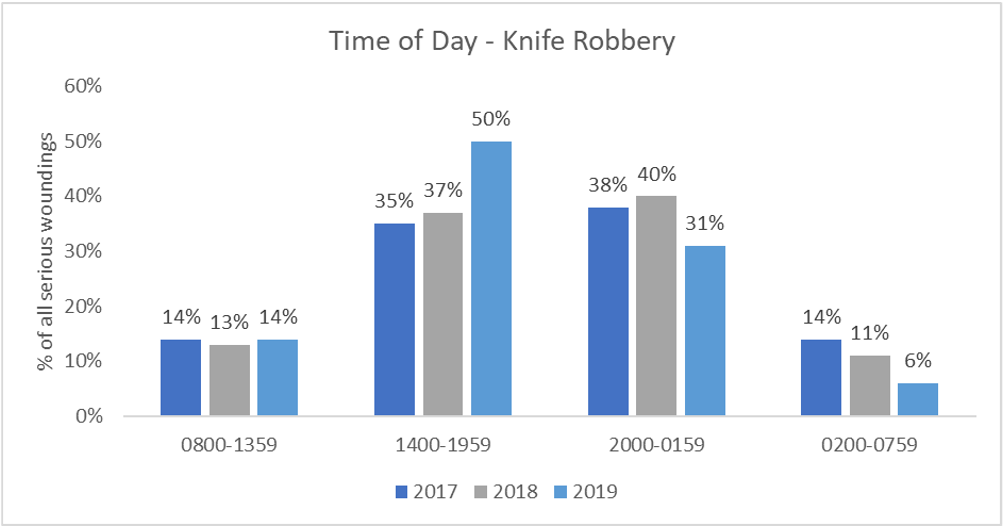
Source: Metropolitan Police Service, CRIS (Crime Recording Information System) data extract, March 2020
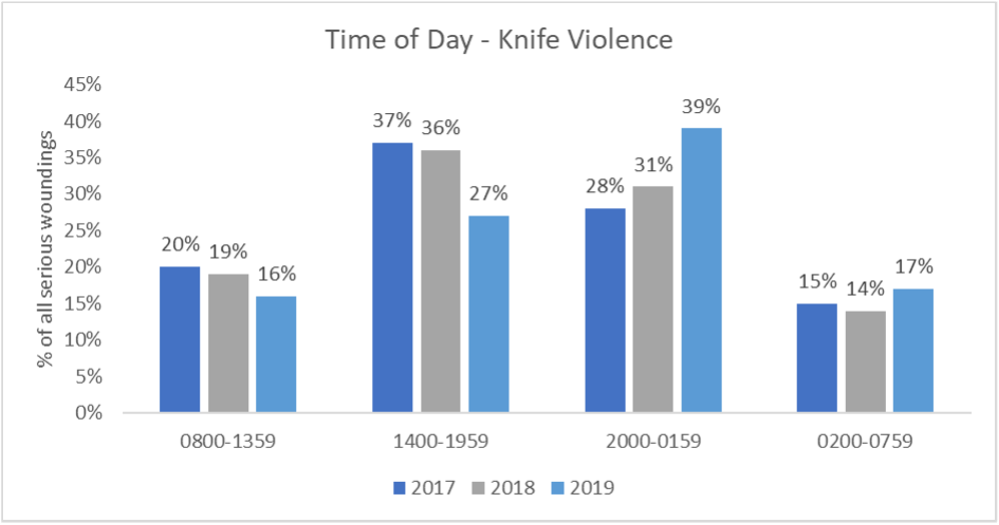
Source: Metropolitan Police Service, CRIS (Crime Recording Information System) data extract, March 2020
Analysis of suspect demographics should be interpreted with caution due to:
- missing data (crimes with no suspect recorded)
- partial data (crimes with limited suspect data e.g., estimated age but no ethnicity).
The analysis below has been conducted on a per crime report basis i.e., percentage number of crimes with a victim or suspect in a demographic group (age, ethnicity or gender). Therefore, percentages can tally to more than 100 due to the potential for multiple victims and suspects.
Over 5 years, approximately 51% of violence with injury crime reports had 1 or more victims aged 25–44. 18% of reports had 1 or more victims aged 18–24 compared to 8% of population (the table below).
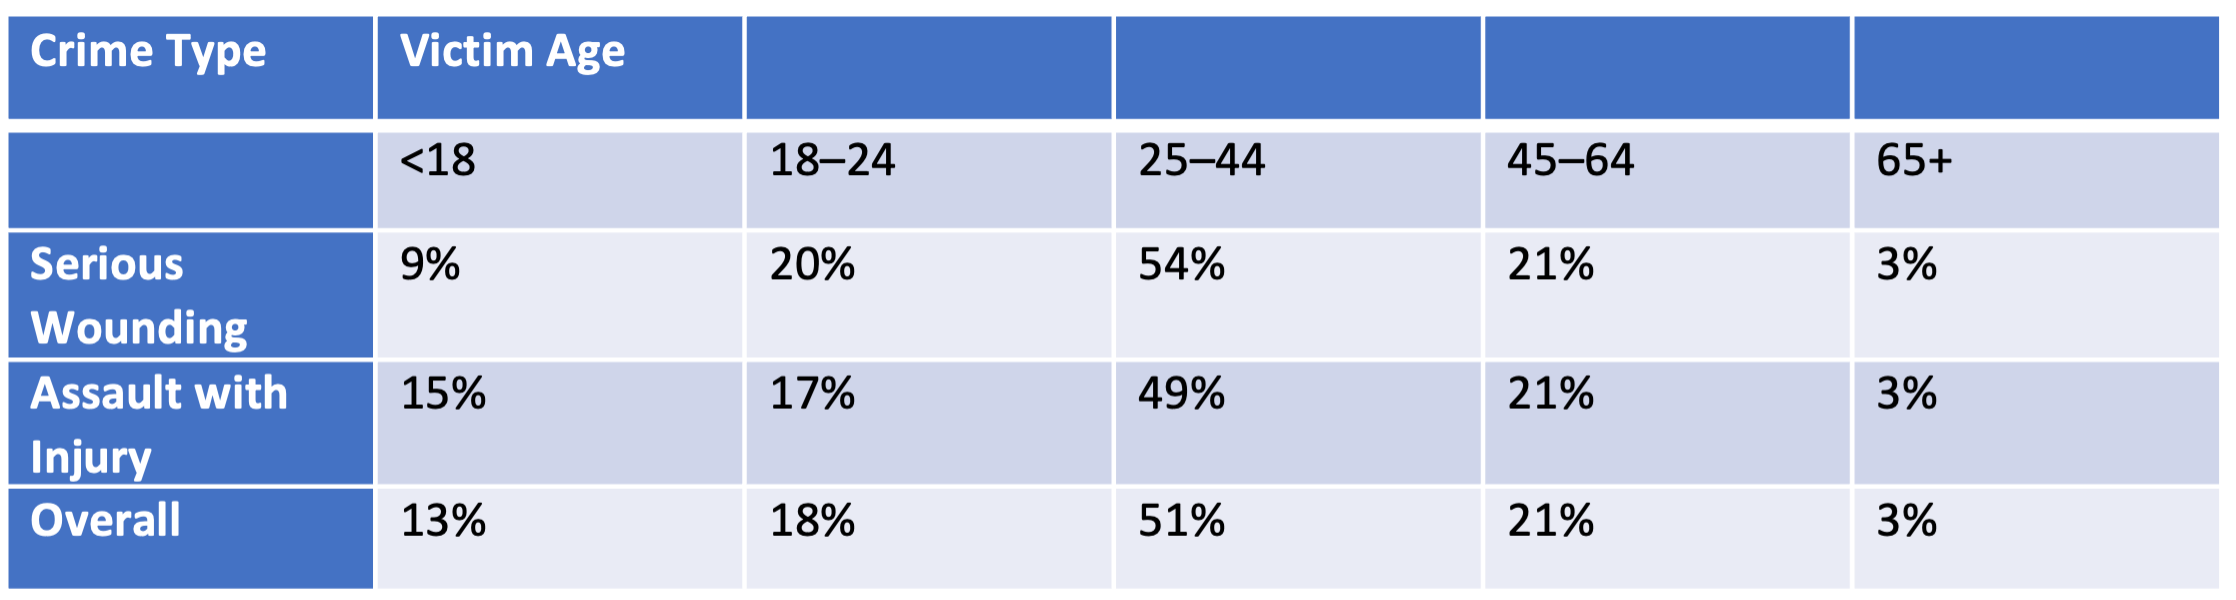
Source: Metropolitan Police Service, CRIS (Crime Recording Information System) data extract, March 2020. Note: Does not include those victims where demographic details were not captured
Approximately 40% of violence with injury crime reports had one or more non-white victims.
Approximately 67% of serious wounding had a male victim (28% female, 5% both), in contrast to assault with injury which was more evenly split (45% male, 51% female, 4% both).
Over 5 years, approximately 54% of violence with injury crime reports had 1 or more suspects aged 25–44. 19% of reports had 1 or more victims aged 18–24, compared to 8% of population (the table below).
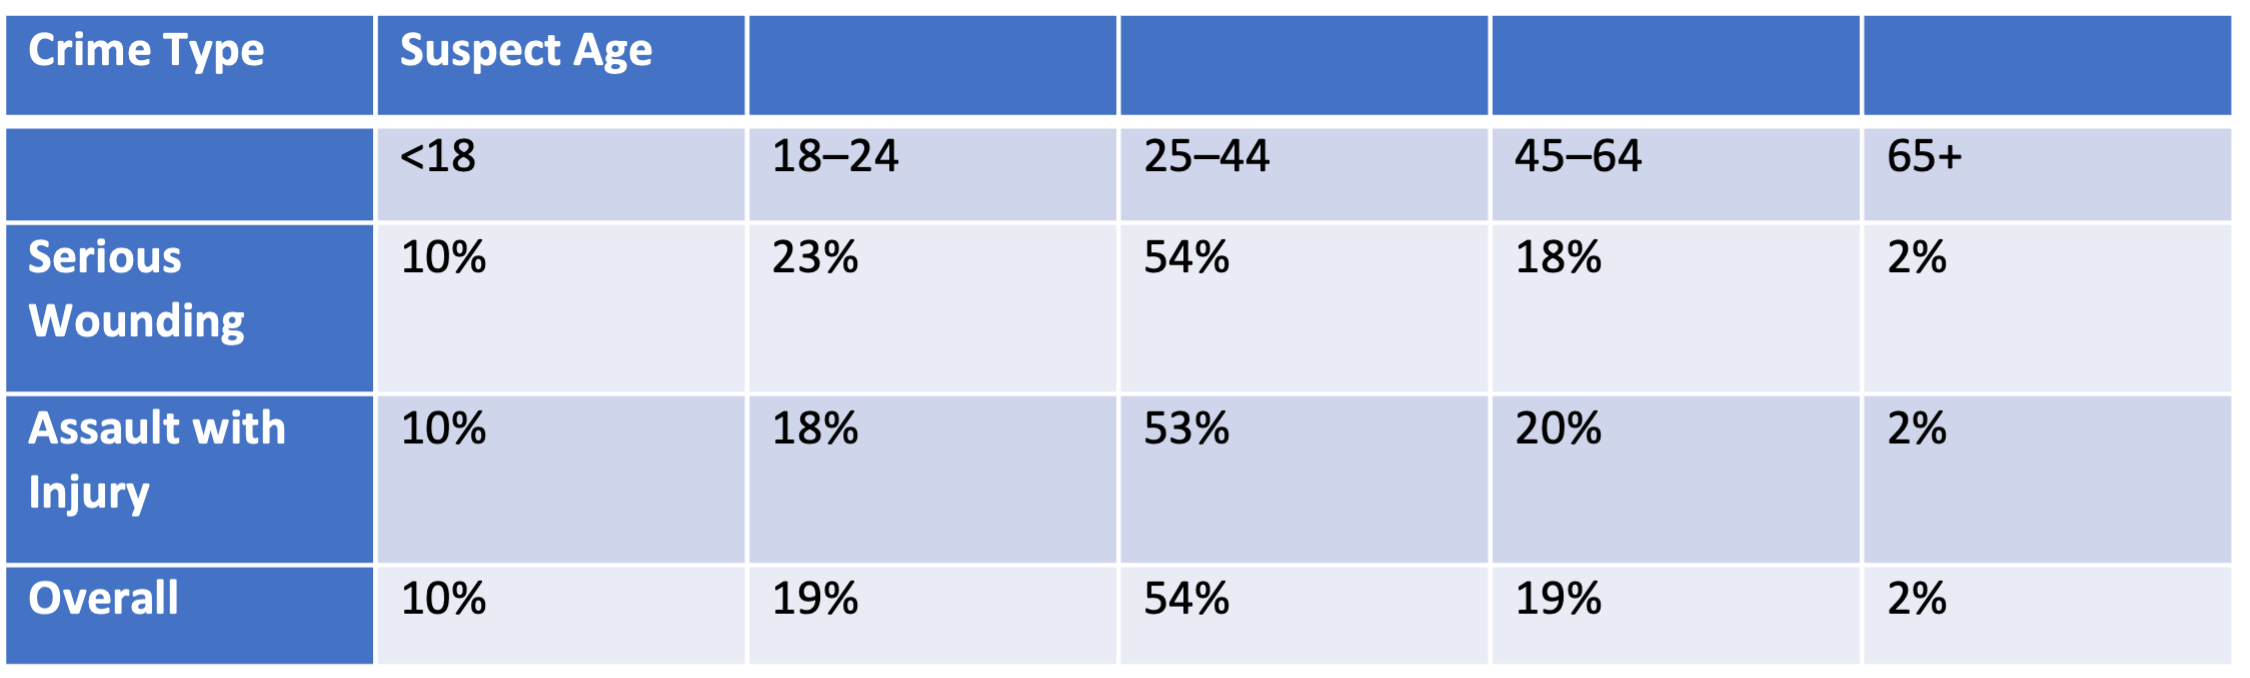
Source: Metropolitan Police Service, CRIS (Crime Recording Information System) data extract, March 2020. Note: Does not include those suspects where demographic details were not captured
Data shows that approximately 48% of violence with injury crime reports had one or more non-white suspects. 80% of serious wounding and 70% of assault with injury offences had 1 or more male suspects.
Over 5 years, victims of knife robbery are most likely to be under the age of 25 (27% of reports with at least one victim aged <18 and 27% of reports with at least one victim aged 18–24). Victims of knife violence are older, 57% aged 25–44 and 24% 18–24. The 18–24 age group is disproportionality represented (only 8% of population).
There is also a disproportionality within ethnicity, particularly knife violence, where 56% of crime reports have a non-white victim. Male victims are most common, particularly within knife robbery (84% vs. 71% knife violence).
Similar trends exist within suspects of knife crime, with a younger cohort of suspects and over-representation of the 18–24 age group and males. However, within ethnicity, while the same disproportionality is seen, it is greater within knife robbery (70% reports with BME suspect) than knife violence (53%).
Over the past 3 years, the 15–24 age cohort accounted for 22% of ambulance callouts for assault (compared to 11% of the population).
6. Homelessness and Rough Sleeping
Good quality and stable housing is vital to the health and wellbeing of the Borough’s population. Homelessness remains a significant challenge in Wandsworth and across London as a result of several factors, including difficulty accessing and maintaining private sector accommodation. Whilst housing costs in Wandsworth have marginally decreased since 2017, housing in the Borough remains less affordable than across London. The Council is undertaking a range of work to tackle homelessness and rough sleeping, as set out in its Housing and Homelessness Strategy 2019-2022, with a focus on preventative measures.
Homelessness and rough sleeping present a significant challenge in Wandsworth and across London, with Councils seeing an increased demand from households approaching as homeless. In April 2018, the Homelessness Reduction Act significantly changed homelessness legislation by placing new duties on councils and an increased emphasis on prevention. The act brought challenges for Wandsworth Council, but also provided an opportunity to tackle homelessness proactively at the earliest possible stage. In 2018, the Government further published a national rough sleeping strategy which aims to end rough sleeping by 2027 accompanied by £100 million funding.
The coronavirus pandemic has put additional pressures to tackle the issue of homelessness in the borough and ensure rough sleepers are protected. This has presented the Council and local partner agencies with a unique opportunity to properly assess the needs of individuals, and tailor the support and housing offer to meet those needs. Following the outbreak of Covid-19, new legislation was put into the place to accommodate all rough sleeper as part of the Government’s “everyone in” campaign. The protocol has seen entrenched rough sleepers, who have previously not engaged with rough sleeping services, taking up offers of temporary housing and people new to rough sleeping, not becoming entrenched.
The Council has placed approximately 360 individuals in emergency accommodation since the start of the pandemic. 128 clients have been moved out of emergency accommodation via the Council’s various rehousing pathways and 50 clients have either resolved their homelessness or abandoned accommodation with no further contact.
Affordability can be cited as a contributing factor the prevalence of homelessness and rough sleeping in the borough. Wandsworth’s housing market prices have continued to rise, with house and rental costs more than double the national average. Whilst housing in Wandsworth became slightly more affordable in 2018, the Borough remains less affordable than across other parts of London (the figures below).
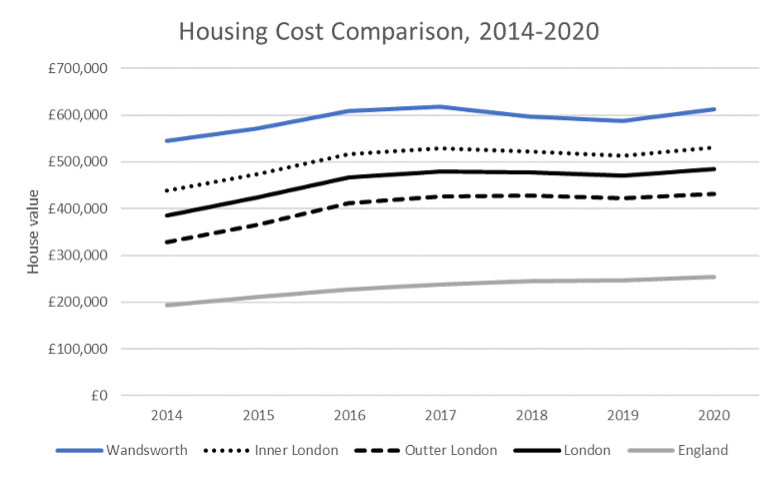
Source: House Price Index (Land Registry) and Average Rent (Valuation Office Agency)
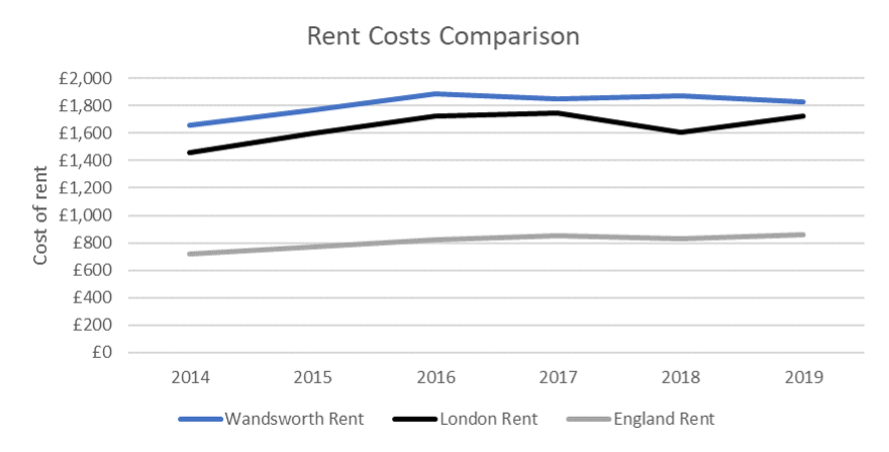
Source: Average Rent (Valuation Office Agency)
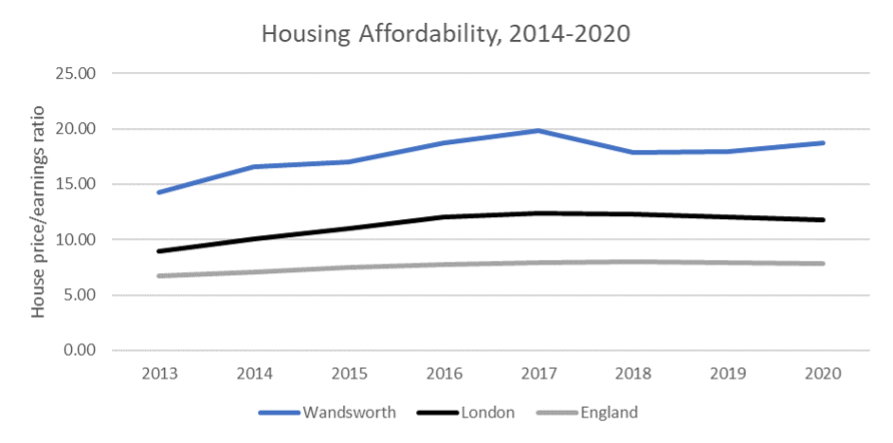
Source: House Price/Earnings Ratio (Office of National Statistics)
The coronavirus pandemic has put additional pressures to tackle the issue of homelessness in the borough and ensure rough sleepers are protected. This has presented the Council and local partner agencies with a unique opportunity to fully assess the needs of individuals, and tailor the support and housing offer to meet those needs. Following the outbreak of Covid-19, new legislation was put into the place to accommodate all rough sleeper as part of the Government’s “Everyone In” campaign. The protocol has seen entrenched rough sleepers, who have previously not engaged with rough sleeping services, taking up offers of temporary housing. It has also helped people new to rough sleeping not becoming entrenched.
6.1 Rate of Homelessness
The rate of homelessness in Wandsworth has remained at just below 6 per 1,000 households over the past five years, except for 2015/16 when it peaked at 6.34. This has followed the London trend, although Wandsworth has a slightly higher rate of homelessness than London as a whole. In common with most London Local Authorities, homelessness in Wandsworth is higher than the England average of 2.41 per 1,000 households (the figure below).
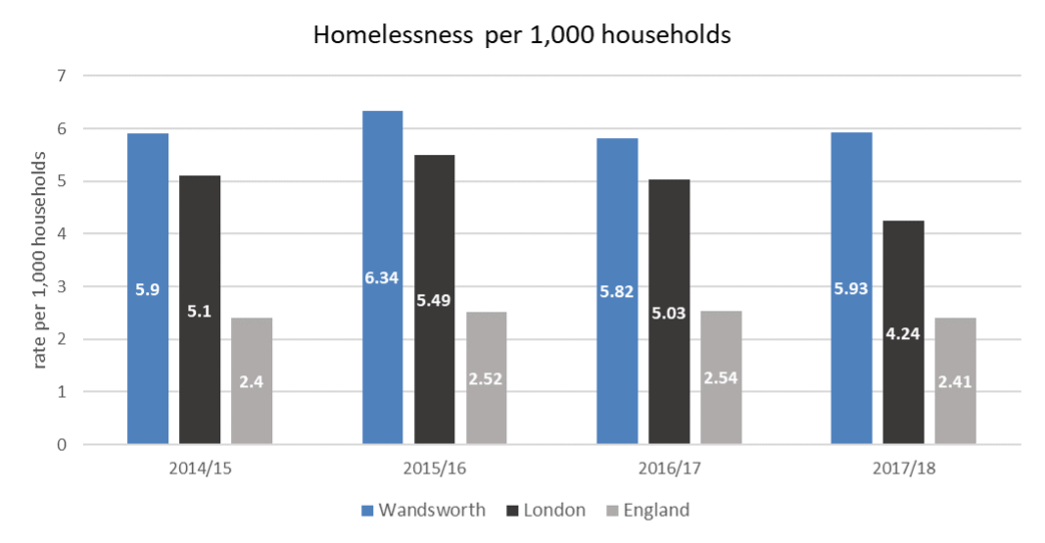
Source: Government statistics (Ministry of Housing, Communities and Local Government)
There is a significant and continued demand from applicants accepted onto the Council’s housing queues with 8,880 applicants on the queue for social housing at the end of 2019/20. In comparison, 876 dwellings were available for social let during that year. This has resulted in an increasing number of households in temporary accommodation in Wandsworth, following the London-wide trend (the figure below).
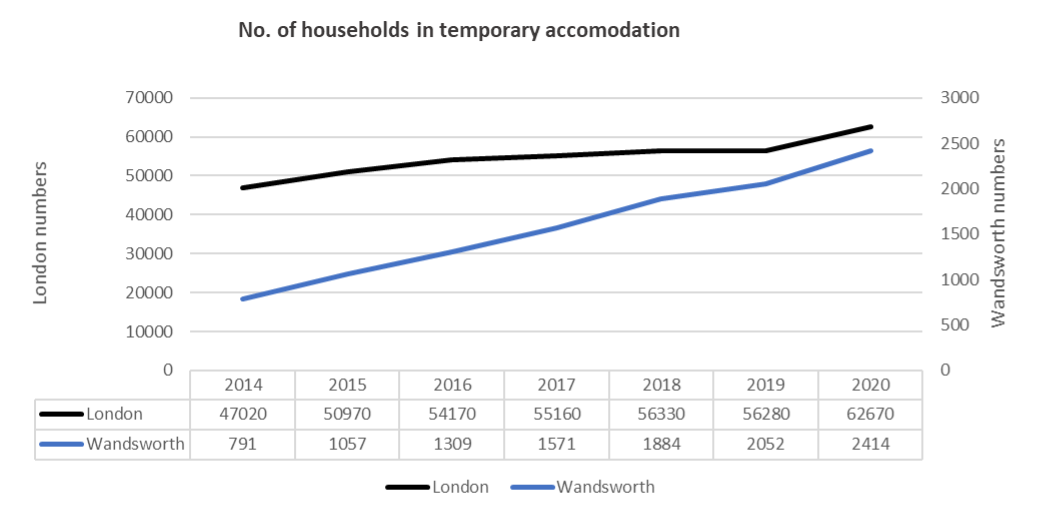
In 2020/21, the Council received 2,471 homelessness applications and 3,702 new applications were accepted onto the housing register. The rate of homelessness in Wandsworth has remained at just below 6 per 1,000 households over the past five years, except for 2015/16 when it peaked at 6.34. This has followed the London trend, although Wandsworth has a slightly higher rate of homelessness than London as a whole. In common with most London authorities, homelessness in Wandsworth is higher than the England average of 2.41 per 1,000 households.
6.2 Causes of Homelessness
As outlined in the figure below, in 2020/21, the main reason for temporary accommodation (TA) admissions in Wandsworth was eviction by friend/relative (37%), highlighting the number of residents reliant on friends or family for a place to live.
Due to emergency legislation suspending any evictions by social or private rented accommodation during the pandemic, there have been a very small number of TA admissions due to loss of privately rented accommodation. This impact of Covid-19 on admissions is evident when compared to previous years, with 26% of admissions in 2019 due to private evictions compared to only 6% in 2020.
31.2% of the Borough’s households live in privately rented accommodation (compared to 25% across London) and therefore there is a higher risk for this group. This is especially true for single parent households which in 2018/19 made up 58% of accepted homeless applicants waiting for an offer of accommodation on the Council’s Housing Register.

Source: Housing and Regeneration Department Data, Wandsworth Council 2020/21
Under homelessness legislation, a household must be assessed as being in ‘priority need’ to be assisted under the main housing duty by a local authority. For cases considered under this main housing duty in 2020/21, dependent children or pregnancy was the most common way households met this criterion (42%). An additional 15% of households were considered in priority need due to mental health issues or learning disabilities. This highlights the real risk mental health conditions or learning disabilities are the security of accommodation (the figure below).
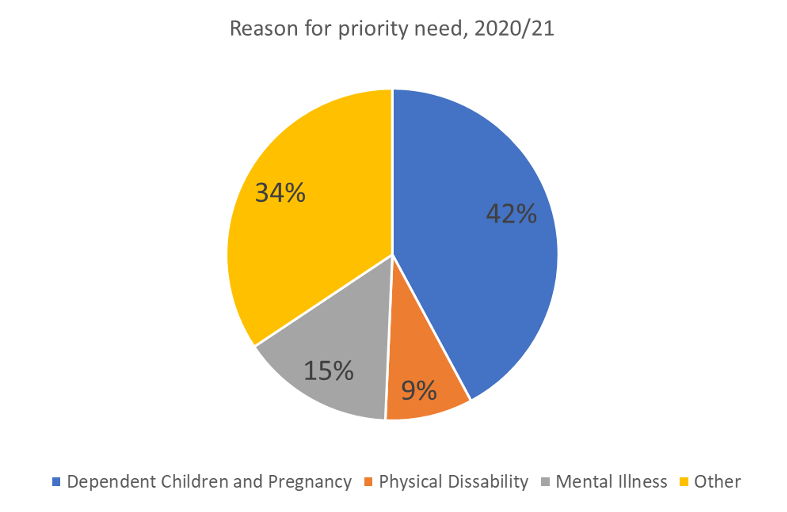
Source: Housing and Regeneration Department Data, Wandsworth Council 2020/21
In the first three quarters of 2019/20, of the 158 rough sleepers who were verified and assessed by SPEAR in the Borough, a significant number struggle with a combination of issues (the figure below). Mental health is the most common, with a third (71) of all rough sleepers in Wandsworth living with at least one recognised mental health problem. Concerningly, around one in five rough sleepers in the area are affected by alcohol need (37) or substance misuse (32) and 17% have a dual diagnosis of both mental health and alcohol/ substance abuse. The complex nature of these issues, the consequences this has on day-to-day life and the difficulty in accessing treatment options, means that securing accommodation is often just one step towards ensuring a person who has slept rough is able to successfully maintain their own tenancy in the future.
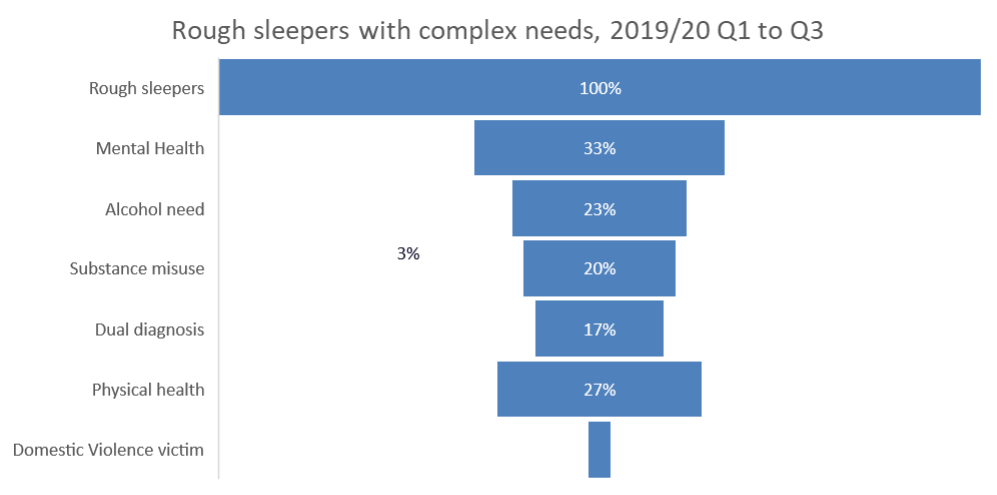
Source: SPEAR data - Wandsworth Q1-Q3 2019/20
The Homelessness Reduction Act fundamentally changed homelessness legislation and therefore comparisons before and after April 2018 should be taken with caution.
6.3 Current Services on Offer
The Council has statutory duties under the Homelessness Reduction Act to undertake work to prevent or relieve homelessness. This includes working with applicants to develop a personalised housing plan, helping to maintain current accommodation where appropriate and identifying other housing options available. Further to this, the Council has a statutory duty to provide accommodation to those deemed to be eligible (as per immigration status), homeless and in priority need, under the Housing Act 1996.
The Council successfully bid for Government funding to provide a rough sleeper outreach service and implement a pathway model to assist rough sleepers in the Borough into accommodation. The Council commissions services through the homelessness charity SPEAR and provides an in-house local lettings service to help rough sleepers access and maintain private accommodation. The Council continues to bid for government funding streams to maintain and enhance this model.
Since April 2019, the borough’s rough sleeping provision has increased exponentially as the Council maximised resources made available through Government initiatives such as RSI (Rough Sleeping Initiative) and RRP (Rapid Rehousing Pathway).
In response to Government guidance, the Council has ensured rough sleepers have been protected from the effects of COVID-19. In particular, the Council has ensured levels of rough sleeping have remained low during the three lockdown periods (23rd March to 1st June 2020, 1st November to 2nd December 2020 and 19th December 2020 onwards) by offering emergency accommodation to individuals verified as rough sleepers, regardless of clinical vulnerabilities or immigration status. Those continuing to sleep rough during these periods were repeatedly made offers of emergency accommodation by the SPEAR outreach team but refused.
The introduction of a Rough Sleeper Team at the Council in January 2021 has proved invaluable. This team has enabled a rapid housing and support needs assessment in house and will form the basis of the new rough sleeping pathway from July.
The Council has made significant investment in prevention services to accompany the Homelessness Reduction Act. This approach has proven successful with exponential growth in homelessness preventions in the borough. This has resulted in a 44% increase in homelessness preventions from 2019/20 to 2020/21 (from 187 preventions in 269). Whilst the primary aim of this work is to reduce the upheaval of households facing homelessness, it also provides an opportunity to reduce the use of temporary accommodation and use social housing more effectively in the longer term.
For 2019/20, the Council successfully bid for around £500k government funding to help tackle rough sleeping in the Borough. This has resulted in the provision of an increased outreach service to identify rough sleepers and a pathway model to help entrenched rough sleepers into accommodation. There were 34 rough sleepers accommodated over the first two quarters of 2019/20. Outreach services have also engaged with 121 rough sleepers in the Borough over this period, compared to 97 for the whole of 2018/19.
References
- Greater London Authority. (2017a). 2016-based population projections: Central Trend-based projection (using a 10-year migration scenario)
- Greater London Authority. (2017b). 2016-based central trend household projection. Borough-level.
- Knapp et al. (2007) Dementia UK: Report to the Alzheimer’s Society Kings College London and London School of Economics and Political Science.
- London Borough of Richmond upon Thames. (2011/2012). Annual Public Health Report.
- London Borough of Richmond upon Thames. (2013a). Joint Strategic Needs Assessment: Mental health and well-being.
- London Borough of Richmond upon Thames. (2013b). Learning Disability Service Users Equalities Profile 2012/13
- London Borough of Richmond upon Thames. (2017). BME Older People Needs Assessment.
- Matthews et al. (2013). A two-decade comparison of prevalence of dementia in individuals aged 65 years and older from three geographical areas of England: results of the Cognitive Function and Ageing Study I and II.
- Mirando-Costillo, C., Woods, B. & Orrell, M. (2010). People with dementia living alone: what are their needs and what kind of support are they receiving? International Psychogeriatrics, 22, 4, 607-617
- NHS Digital. (2016). Adult Psychiatric Morbidity Survey: Survey of Mental Health and Well-being, England, 2014.
- NHS Digital. (2017a). Registered Blind and Partially Sighted People, England 2016/17.
- NHS Digital. (2017b). Adult social care activity and finance report-, Short- and Long-Term Care statistics.
- NHS Digital (2017c). Survey of Adult Carers in England, 2017/17.
- NHS Richmond CCG. (2018). Identification of Carers in GP practices.
- England and NHS South of England. (2012). Dementia Prevalence Calculator.
- NHS Information Centre for Health and Social Care . (2010). Survey of Carers in Households 2009/10.
- NICE (2020). Supporting adult Carers NICE Guidance (NG150)
- Office for National Statistics. (2013c). 2011 Census Analysis: Unpaid care in England and Wales, 2011 and comparison with 2001.
- Office for National Statistics. (2013b). Ethnic Variations in General Health and Unpaid Care Provision 2011.
- Office for National Statistics. (2013a). Full story: The gender gap in unpaid care provision: is there an impact on health and economic position?
- Pickard, L. (2008). Informal Care for Older People Provided by Their Adult Children: Projections of Supply and Demand to 2041 in England. Personal Social Services Research Unit.
- Pinquart, M., & Sorensen, S. (2007). Correlates of Physical Health of Informal Caregivers: A Meta-Analysis. Journal of Gerontology, volume 62B, number 2, page 126-137.
- Public Health England. (2013). Learning Disabilities Profile 2013 Richmond upon Thames.
- The Health and Social Care Information Centre. (2010b). People registered as deaf or hard of hearing, year ending 31 March 2010.
- Wilkinson, R. (1996). Unhealthy societies: the afflictions of inequality. London: Routledge
Ordinance Survey. OS Maps Britain’s High Streets. 2019. URL: https://www.ordnancesurvey.co.uk/demos/high-streets/high-streets/index.html#11.93/51.45365/-0.19024↩︎
Achakulwisut P, Brauer M, Hystad P, Anenberg SC. Global, national, and urban burdens of paediatric asthma incidence attributable to ambient NO2 pollution: estimates from global datasets. Lancet Planet Health 2019 Apr 10. doi:10.1016/S2542-5196(19)30046-4.↩︎
Mayor of London. Cleaner Vehicles. 2019. Data used: 2019. URL: https://www.london.gov.uk/programmes-strategies/environment-and-climate-change/pollution-and-air-quality↩︎
Data.London. London Atmospheric Emissions 2019. Data used: 2019. URL: https://data.london.gov.uk/dataset/london-atmospheric-emissions-inventory--laei--2019↩︎
London Datastore. Traffic Flows of all vehicles and cars only. 1993–2018. Data used: 2018. URL: https://data.london.gov.uk/dataset/traffic-flows-borough↩︎
London Datastore. Licensed Vehicles - Numbers, Borough. 1997–2018. Data used: 2018. URL: https://data.london.gov.uk/dataset/licensed-vehicles-numbers-borough↩︎
URL: https://www.gov.uk/government/collections/uk-local-authority-and-regional-greenhouse-gas-emissions-national-statistics↩︎
Ordinance Survey. OS Maps Britain’s High Streets. 2019. URL: https://www.ordnancesurvey.co.uk/demos/high-streets/high-streets/index.html#11.93/51.45365/-0.19024↩︎
CPRE. London Boroughs Healthy Street Scorecard July 2019. URL: https://www.cprelondon.org.uk/↩︎
DataWand – Housing. Dwelling counts, Wandsworth. 2019. URL: https://www.datawand.info/housing/↩︎
DataWand – Housing. URL: https://www.datawand.info/housing/↩︎
London Datastore. Housing Tenure by Borough (ONS Annual Population Survey). 2019. URL: https://data.london.gov.uk/dataset/housing-tenure-borough↩︎
London Datastore. Land use by Borough and Ward. 2005. URL: https://data.london.gov.uk/dataset/land-use-ward↩︎
Enable Leisure and Culture. What is biodiversity? URL: https://enablelc.org/parks/biodiversity/↩︎
GLA Datastore hosts an interactive visualization tool. URL: https://data.london.gov.uk/census/lwzc/visualisation-tool/↩︎
Office of National Statistics. Business demography, UK., 2017. URL: https://www.ons.gov.uk/businessindustryandtrade/business/activitysizeandlocation/datasets/businessdemographyreferencetable↩︎
Wandsworth Council: Development Management Policies. URL: https://www.wandsworth.gov.uk/media/1424/development_management_policies.pdf↩︎
URL: https://www.wandsworth.gov.uk/media/1629/town_centre_uses_spd_adopted_version_2015.pdf↩︎
ONS. Travel to work, England and Wales: Census 2021. URL: https://www.ons.gov.uk/employmentandlabourmarket/peopleinwork/employmentandemployeetypes/bulletins/traveltoworkenglandandwales/census2021↩︎
Transport for London: WebCat. URL: https://tfl.gov.uk/info-for/urban-planning-and-construction/planning-with-webcat/webcat↩︎
London Datastore. Public Transport Accessibility Levels, 2008–2014. Data used: 2014. URL: https://data.london.gov.uk/dataset/public-transport-accessibility-levels↩︎
London Datastore. Traffic Flows of all vehicles and cars only. 1993–2018. Data used: 2018. URL: https://data.london.gov.uk/dataset/traffic-flows-borough↩︎
London Datastore. Licensed Vehicles - Numbers, Borough. 1997–2018. Data used: 2018. URL: https://data.london.gov.uk/dataset/licensed-vehicles-numbers-borough↩︎
It was noted that no differences were found in terms of recreational physical activity levels of respondents by travel mode category.↩︎
Sahlqvist, S, Song, Y, Ogilvie, D. Is active travel associated with greater physical activity? The contribution of commuting and non-commuting active travel to total physical activity in adults. Preventative Medicine. [Online] September 2012;55(3): 206-211. URL: https://www.sciencedirect.com/science/article/pii/S0091743512003088?via%3Dihub. 2020.↩︎
The health benefits of cycling outweigh the risk caused by pollution residents get exposed to when cycling except when pollution reaches a certain level.↩︎
Ogilvie D, Mitchell R, Mutrie N, Petticrew M, Platt S. Shoe leather epidemiology: active travel and transport infrastructure in the urban landscape. International Journal of Behavioural Nutrition and Physical Activity 7: 43. 2010.↩︎
URL: https://tfl.gov.uk/corporate/about-tfl/how-we-work/planning-for-the-future/healthy-streets↩︎
URL: http://content.tfl.gov.uk/mts-walking-action-plan.pdf↩︎
Paths for everyone: Sustrans’ review of the national Cycle Network 2018. URL: https://www.sustrans.org.uk/media/2804/paths_for_everyone_ncn_review_report_2018.pdf↩︎
Renton, A., Phillips, G., Daykin, N., Yu, G., Taylor, K. et al. (2012). Think of your Art-eries: Arts participation, behavioural cardiovascular risk factors and mental well-being in deprived communities in London. Public Health, (126), pp. S57–64.↩︎
URL: http://i5health.com/SPReports/COP_Report_SP_EPP_WandsworthCCG_ver2.0.pdf)↩︎
URL: https://www.wandsworth.gov.uk/leisure-and-culture/places-of-worship/↩︎
Social Isolation
Adverse consequences of social isolation range from sleeplessness to reduced immune function. It is associated with higher anxiety, depression, and increased risk of suicide.
Social Isolation in Adult Social Care Users Aged 18 and Over
Social Isolation: percentage of adult social care users who have as much social contact as they would like: In 2022/23, Wandsworth’s rate was 43.2% (n=1290), which was the 5th highest in London, 2.7% lower than the England average and 8.8% higher than the London average. The latest Borough figure for 2022/23 was also 4.6% higher than in 2010/11, in comparison with 6.0% increase in England’s rate in the equivalent time period.
Source: OHID: Public Health Profiles
Source: OHID: Public Health Profiles
Social Isolation in Adult Social Care Users Aged 65 and Over
Social Isolation: percentage of adult social care users who have as much social contact as they would like: In 2022/23, Wandsworth’s rate was 39.1% (n=610), which was the 5th highest in London, 5.8% lower than the England average and 9.5% higher than the London average. The latest Borough figure for 2022/23 was also 4.9% lower than in 2014/15, in comparison with 3.0% decrease in England’s rate in the equivalent time period.
Source: OHID: Public Health Profiles
Source: OHID: Public Health Profiles