Market Position Statement - Our market landscape
Back to the Market Position Statement home page.
Market overview and analysis
We want to foster a diverse and sustainable care and support market, where our providers are supported to deliver the highest quality of support and services possible.
We collectively need to find ways of working together to support the increasing numbers of people seeking help from adult social care and the increase we see in safeguarding enquiries, for example. Our residents have more complex needs as our population continues to age with co-existing conditions, an increase in the numbers of people living in poor housing circumstances and with poor mental health.
We have 52 unique contracted providers in Wandsworth, with a further 42 contracted providers who work across Richmond and Wandsworth.
The overall budget per client group, including non-contracted providers, for 2024-25 is as follows:
| Client group | 2024-25 budget |
| Older people, physical and sensory disabilities | £28,897,700 |
| Adults with a learning disability | £39,403,700 |
| Adults with mental health needs | 10,150,200 |
Overview of quality
The proportion of regulated adult social care services rated good or above by Care Quality Commission (CQC) is better than comparator and national averages in terms of nursing care and homecare provision indicating that the quality of services within the borough is high. The proportion of residential care rated good and above is slightly lower than the national average. Local authorities, the NHS and partners have a wider responsibility to promote quality across all sectors, and our commissioners work with providers on quality improvements through our quality assurance team.
To help us to work with the market to foster continual improvement, we use the provider assessment and market management solution (PAMMS) which is an online assessment and auditing tool and framework which helps us assess the quality of care delivered by providers. It supports collaborative working with providers, identifying what is working well, and areas for improvement where we can provide additional support and advice.
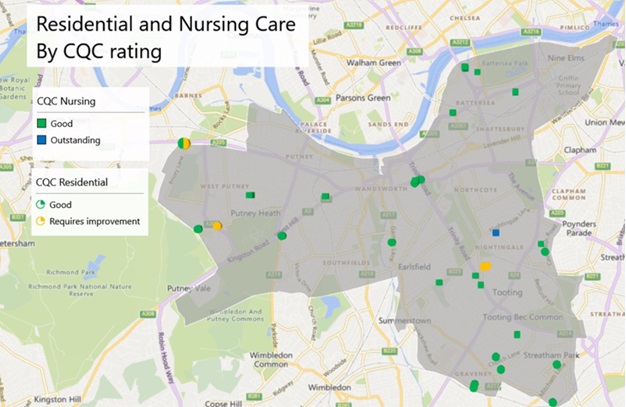
Map colour key:
- Red - Inadequate
- Yellow - Requires improvement
- Green - Good
- Blue - Outstanding
Map shape key:
- Nursing homes - Squares
- Residential homes - Circles
Home care and other services are not shown on the map.
The table below shows how Wandsworth's nursing homes are rated by the CQC.
| Nursing homes | Inadequate | Requires improvement | Good | Outstanding |
| Wandsworth | 0% | 0% | 92% (12) | 8% (1) |
| England | 1% | 21% | 73% | 5% |
| SW London | 0% | 9% | 87% | 4% |
The table below shows how Wandsworth's residential homes are rated by the CQC.
| Residential homes | Inadequate | Requires improvement | Good | Outstanding |
| Wandsworth | 0% | 0% | 82% (13) | 0% |
| England | 1% | 17% | 78% | 4% |
| SW London | 1% | 14% | 83% | 3% |
The table below shows how Wandsworth's home care services are rated by the CQC.
| Home care services | Inadequate | Requires improvement | Good | Outstanding |
| Wandsworth* | 0% | 0% | 71% (22) | 3% (1) |
| England | 1% | 14% | 81% | 5% |
| SW London | 1% | 13% | 83% | 2% |
* One home care service had insufficient evidence to rate, seven were unrated.
The table below shows how other care services in Wandsworth are rated by the CQC.
| Other services | Inadequate | Requires improvement | Good | Outstanding |
| Wandsworth | 0% | 0% | 89% (8) | 11% (1) |
| England | 0% | 11% | 84% | 5% |
| SW London | 0% | 9% | 88% | 3% |